Quantcast
Channel: MachineLearningMastery.com
Viewing all 255 articles
Browse latest View live

How and When to Use ROC Curves and Precision-Recall Curves for Classification in Python

$
0
0

It can be more flexible to predict probabilities of an observation belonging to each class in a classification problem rather than predicting classes directly.

This flexibility comes from the way that probabilities may be interpreted using different thresholds that allow the operator of the model to trade-off concerns in the errors made by the model, such as the number of false positives compared to the number of false negatives. This is required when using models where the cost of one error outweighs the cost of other types of errors.

Two diagnostic tools that help in the interpretation of probabilistic forecast for binary (two-class) classification predictive modeling problems are ROC Curves and Precision-Recall curves.

In this tutorial, you will discover ROC Curves, Precision-Recall Curves, and when to use each to interpret the prediction of probabilities for binary classification problems.

After completing this tutorial, you will know:

  • ROC Curves summarize the trade-off between the true positive rate and false positive rate for a predictive model using different probability thresholds.
  • Precision-Recall curves summarize the trade-off between the true positive rate and the positive predictive value for a predictive model using different probability thresholds.
  • ROC curves are appropriate when the observations are balanced between each class, whereas precision-recall curves are appropriate for imbalanced datasets.

Let’s get started.

  • Update Aug/2018: Fixed bug in the representation of the no skill line for the precision-recall plot. Also fixed typo where I referred to ROC as relative rather than receiver (thanks spellcheck).
  • Update Nov/2018: Fixed description on interpreting size of values on each axis, thanks Karl Humphries.
How and When to Use ROC Curves and Precision-Recall Curves for Classification in Python

How and When to Use ROC Curves and Precision-Recall Curves for Classification in Python
Photo by Giuseppe Milo, some rights reserved.

Tutorial Overview

This tutorial is divided into 6 parts; they are:

  1. Predicting Probabilities
  2. What Are ROC Curves?
  3. ROC Curves and AUC in Python
  4. What Are Precision-Recall Curves?
  5. Precision-Recall Curves and AUC in Python
  6. When to Use ROC vs. Precision-Recall Curves?

Predicting Probabilities

In a classification problem, we may decide to predict the class values directly.

Alternately, it can be more flexible to predict the probabilities for each class instead. The reason for this is to provide the capability to choose and even calibrate the threshold for how to interpret the predicted probabilities.

For example, a default might be to use a threshold of 0.5, meaning that a probability in [0.0, 0.49] is a negative outcome (0) and a probability in [0.5, 1.0] is a positive outcome (1).

This threshold can be adjusted to tune the behavior of the model for a specific problem. An example would be to reduce more of one or another type of error.

When making a prediction for a binary or two-class classification problem, there are two types of errors that we could make.

  • False Positive. Predict an event when there was no event.
  • False Negative. Predict no event when in fact there was an event.

By predicting probabilities and calibrating a threshold, a balance of these two concerns can be chosen by the operator of the model.

For example, in a smog prediction system, we may be far more concerned with having low false negatives than low false positives. A false negative would mean not warning about a smog day when in fact it is a high smog day, leading to health issues in the public that are unable to take precautions. A false positive means the public would take precautionary measures when they didn’t need to.

A common way to compare models that predict probabilities for two-class problems is to use a ROC curve.

What Are ROC Curves?

A useful tool when predicting the probability of a binary outcome is the Receiver Operating Characteristic curve, or ROC curve.

It is a plot of the false positive rate (x-axis) versus the true positive rate (y-axis) for a number of different candidate threshold values between 0.0 and 1.0. Put another way, it plots the false alarm rate versus the hit rate.

The true positive rate is calculated as the number of true positives divided by the sum of the number of true positives and the number of false negatives. It describes how good the model is at predicting the positive class when the actual outcome is positive.

True Positive Rate = True Positives / (True Positives + False Negatives)

The true positive rate is also referred to as sensitivity.

Sensitivity = True Positives / (True Positives + False Negatives)

The false positive rate is calculated as the number of false positives divided by the sum of the number of false positives and the number of true negatives.

It is also called the false alarm rate as it summarizes how often a positive class is predicted when the actual outcome is negative.

False Positive Rate = False Positives / (False Positives + True Negatives)

The false positive rate is also referred to as the inverted specificity where specificity is the total number of true negatives divided by the sum of the number of true negatives and false positives.

Specificity = True Negatives / (True Negatives + False Positives)

Where:

False Positive Rate = 1 - Specificity

The ROC curve is a useful tool for a few reasons:

  • The curves of different models can be compared directly in general or for different thresholds.
  • The area under the curve (AUC) can be used as a summary of the model skill.

The shape of the curve contains a lot of information, including what we might care about most for a problem, the expected false positive rate, and the false negative rate.

To make this clear:

  • Smaller values on the x-axis of the plot indicate lower false positives and higher true negatives.
  • Larger values on the y-axis of the plot indicate higher true positives and lower false negatives.

If you are confused, remember, when we predict a binary outcome, it is either a correct prediction (true positive) or not (false positive). There is a tension between these options, the same with true negative and false positives.

A skilful model will assign a higher probability to a randomly chosen real positive occurrence than a negative occurrence on average. This is what we mean when we say that the model has skill. Generally, skilful models are represented by curves that bow up to the top left of the plot.

A model with no skill is represented at the point [0.5, 0.5]. A model with no skill at each threshold is represented by a diagonal line from the bottom left of the plot to the top right and has an AUC of 0.5.

A model with perfect skill is represented at a point [0.0 ,1.0]. A model with perfect skill is represented by a line that travels from the bottom left of the plot to the top left and then across the top to the top right.

An operator may plot the ROC curve for the final model and choose a threshold that gives a desirable balance between the false positives and false negatives.

ROC Curves and AUC in Python

We can plot a ROC curve for a model in Python using the roc_curve() scikit-learn function.

The function takes both the true outcomes (0,1) from the test set and the predicted probabilities for the 1 class. The function returns the false positive rates for each threshold, true positive rates for each threshold and thresholds.

# calculate roc curve
fpr, tpr, thresholds = roc_curve(y, probs)

The AUC for the ROC can be calculated using the roc_auc_score() function.

Like the roc_curve() function, the AUC function takes both the true outcomes (0,1) from the test set and the predicted probabilities for the 1 class. It returns the AUC score between 0.0 and 1.0 for no skill and perfect skill respectively.

# calculate AUC
auc = roc_auc_score(y, probs)
print('AUC: %.3f' % auc)

A complete example of calculating the ROC curve and AUC for a logistic regression model on a small test problem is listed below.

# roc curve and auc
from sklearn.datasets import make_classification
from sklearn.neighbors import KNeighborsClassifier
from sklearn.model_selection import train_test_split
from sklearn.metrics import roc_curve
from sklearn.metrics import roc_auc_score
from matplotlib import pyplot
# generate 2 class dataset
X, y = make_classification(n_samples=1000, n_classes=2, weights=[1,1], random_state=1)
# split into train/test sets
trainX, testX, trainy, testy = train_test_split(X, y, test_size=0.5, random_state=2)
# fit a model
model = KNeighborsClassifier(n_neighbors=3)
model.fit(trainX, trainy)
# predict probabilities
probs = model.predict_proba(testX)
# keep probabilities for the positive outcome only
probs = probs[:, 1]
# calculate AUC
auc = roc_auc_score(testy, probs)
print('AUC: %.3f' % auc)
# calculate roc curve
fpr, tpr, thresholds = roc_curve(testy, probs)
# plot no skill
pyplot.plot([0, 1], [0, 1], linestyle='--')
# plot the roc curve for the model
pyplot.plot(fpr, tpr, marker='.')
# show the plot
pyplot.show()

Running the example prints the area under the ROC curve.

AUC: 0.895

A plot of the ROC curve for the model is also created showing that the model has skill.

Line Plot of ROC Curve

Line Plot of ROC Curve

What Are Precision-Recall Curves?

There are many ways to evaluate the skill of a prediction model.

An approach in the related field of information retrieval (finding documents based on queries) measures precision and recall.

These measures are also useful in applied machine learning for evaluating binary classification models.

Precision is a ratio of the number of true positives divided by the sum of the true positives and false positives. It describes how good a model is at predicting the positive class. Precision is referred to as the positive predictive value.

Positive Predictive Power = True Positives / (True Positives + False Positives)

or

Precision = True Positives / (True Positives + False Positives)

Recall is calculated as the ratio of the number of true positives divided by the sum of the true positives and the false negatives. Recall is the same as sensitivity.

Recall = True Positives / (True Positives + False Negatives)

or

Sensitivity = True Positives / (True Positives + False Negatives)

Recall == Sensitivity

Reviewing both precision and recall is useful in cases where there is an imbalance in the observations between the two classes. Specifically, there are many examples of no event (class 0) and only a few examples of an event (class 1).

The reason for this is that typically the large number of class 0 examples means we are less interested in the skill of the model at predicting class 0 correctly, e.g. high true negatives.

Key to the calculation of precision and recall is that the calculations do not make use of the true negatives. It is only concerned with the correct prediction of the minority class, class 1.

A precision-recall curve is a plot of the precision (y-axis) and the recall (x-axis) for different thresholds, much like the ROC curve.

The no-skill line is defined by the total number of positive cases divide by the total number of positive and negative cases. For a dataset with an equal number of positive and negative cases, this is a straight line at 0.5. Points above this line show skill.

A model with perfect skill is depicted as a point at [1.0,1.0]. A skilful model is represented by a curve that bows towards [1.0,1.0] above the flat line of no skill.

There are also composite scores that attempt to summarize the precision and recall; three examples include:

  • F score or F1 score: that calculates the harmonic mean of the precision and recall (harmonic mean because the precision and recall are ratios).
  • Average precision: that summarizes the weighted increase in precision with each change in recall for the thresholds in the precision-recall curve.
  • Area Under Curve: like the AUC, summarizes the integral or an approximation of the area under the precision-recall curve.

In terms of model selection, F1 summarizes model skill for a specific probability threshold, whereas average precision and area under curve summarize the skill of a model across thresholds, like ROC AUC.

This makes precision-recall and a plot of precision vs. recall and summary measures useful tools for binary classification problems that have an imbalance in the observations for each class.

Precision-Recall Curves in Python

Precision and recall can be calculated in scikit-learn via the precision_score() and recall_score() functions.

The precision and recall can be calculated for thresholds using the precision_recall_curve() function that takes the true output values and the probabilities for the positive class as output and returns the precision, recall and threshold values.

# calculate precision-recall curve
precision, recall, thresholds = precision_recall_curve(testy, probs)

The F1 score can be calculated by calling the f1_score() function that takes the true class values and the predicted class values as arguments.

# calculate F1 score
f1 = f1_score(testy, yhat)

The area under the precision-recall curve can be approximated by calling the auc() function and passing it the recall and precision values calculated for each threshold.

# calculate precision-recall AUC
auc = auc(recall, precision)

Finally, the average precision can be calculated by calling the average_precision_score() function and passing it the true class values and the predicted class values.

The complete example is listed below.

# precision-recall curve and f1
from sklearn.datasets import make_classification
from sklearn.neighbors import KNeighborsClassifier
from sklearn.model_selection import train_test_split
from sklearn.metrics import precision_recall_curve
from sklearn.metrics import f1_score
from sklearn.metrics import auc
from sklearn.metrics import average_precision_score
from matplotlib import pyplot
# generate 2 class dataset
X, y = make_classification(n_samples=1000, n_classes=2, weights=[1,1], random_state=1)
# split into train/test sets
trainX, testX, trainy, testy = train_test_split(X, y, test_size=0.5, random_state=2)
# fit a model
model = KNeighborsClassifier(n_neighbors=3)
model.fit(trainX, trainy)
# predict probabilities
probs = model.predict_proba(testX)
# keep probabilities for the positive outcome only
probs = probs[:, 1]
# predict class values
yhat = model.predict(testX)
# calculate precision-recall curve
precision, recall, thresholds = precision_recall_curve(testy, probs)
# calculate F1 score
f1 = f1_score(testy, yhat)
# calculate precision-recall AUC
auc = auc(recall, precision)
# calculate average precision score
ap = average_precision_score(testy, probs)
print('f1=%.3f auc=%.3f ap=%.3f' % (f1, auc, ap))
# plot no skill
pyplot.plot([0, 1], [0.5, 0.5], linestyle='--')
# plot the roc curve for the model
pyplot.plot(recall, precision, marker='.')
# show the plot
pyplot.show()

Running the example first prints the F1, area under curve (AUC) and average precision (AP) scores.

f1=0.836 auc=0.892 ap=0.840

The precision-recall curve plot is then created showing the precision/recall for each threshold compared to a no skill model.

Line Plot of Precision-Recall Curve

Line Plot of Precision-Recall Curve

When to Use ROC vs. Precision-Recall Curves?

Generally, the use of ROC curves and precision-recall curves are as follows:

  • ROC curves should be used when there are roughly equal numbers of observations for each class.
  • Precision-Recall curves should be used when there is a moderate to large class imbalance.

The reason for this recommendation is that ROC curves present an optimistic picture of the model on datasets with a class imbalance.

However, ROC curves can present an overly optimistic view of an algorithm’s performance if there is a large skew in the class distribution. […] Precision-Recall (PR) curves, often used in Information Retrieval , have been cited as an alternative to ROC curves for tasks with a large skew in the class distribution.

The Relationship Between Precision-Recall and ROC Curves, 2006.

Some go further and suggest that using a ROC curve with an imbalanced dataset might be deceptive and lead to incorrect interpretations of the model skill.

[…] the visual interpretability of ROC plots in the context of imbalanced datasets can be deceptive with respect to conclusions about the reliability of classification performance, owing to an intuitive but wrong interpretation of specificity. [Precision-recall curve] plots, on the other hand, can provide the viewer with an accurate prediction of future classification performance due to the fact that they evaluate the fraction of true positives among positive predictions

The Precision-Recall Plot Is More Informative than the ROC Plot When Evaluating Binary Classifiers on Imbalanced Datasets, 2015.

The main reason for this optimistic picture is because of the use of true negatives in the False Positive Rate in the ROC Curve and the careful avoidance of this rate in the Precision-Recall curve.

If the proportion of positive to negative instances changes in a test set, the ROC curves will not change. Metrics such as accuracy, precision, lift and F scores use values from both columns of the confusion matrix. As a class distribution changes these measures will change as well, even if the fundamental classifier performance does not. ROC graphs are based upon TP rate and FP rate, in which each dimension is a strict columnar ratio, so do not depend on class distributions.

ROC Graphs: Notes and Practical Considerations for Data Mining Researchers, 2003.

We can make this concrete with a short example.

Below is the same ROC Curve example with a modified problem where there is a 10:1 ratio of class=0 to class=1 observations.

# roc curve and auc on imbalanced dataset
from sklearn.datasets import make_classification
from sklearn.neighbors import KNeighborsClassifier
from sklearn.model_selection import train_test_split
from sklearn.metrics import roc_curve
from sklearn.metrics import roc_auc_score
from matplotlib import pyplot
# generate 2 class dataset
X, y = make_classification(n_samples=1000, n_classes=2, weights=[0.9,0.09], random_state=1)
# split into train/test sets
trainX, testX, trainy, testy = train_test_split(X, y, test_size=0.5, random_state=2)
# fit a model
model = KNeighborsClassifier(n_neighbors=3)
model.fit(trainX, trainy)
# predict probabilities
probs = model.predict_proba(testX)
# keep probabilities for the positive outcome only
probs = probs[:, 1]
# calculate AUC
auc = roc_auc_score(testy, probs)
print('AUC: %.3f' % auc)
# calculate roc curve
fpr, tpr, thresholds = roc_curve(testy, probs)
# plot no skill
pyplot.plot([0, 1], [0, 1], linestyle='--')
# plot the roc curve for the model
pyplot.plot(fpr, tpr, marker='.')
# show the plot
pyplot.show()

Running the example suggests that the model has skill.

AUC: 0.713

Indeed, it has skill, but much of that skill is measured as making correct false negative predictions and there are a lot of false negative predictions to make.

A plot of the ROC Curve confirms the AUC interpretation of a skilful model for most probability thresholds.

Line Plot of ROC Curve Imbalanced Dataset

Line Plot of ROC Curve Imbalanced Dataset

We can also repeat the test of the same model on the same dataset and calculate a precision-recall curve and statistics instead.

The complete example is listed below.

# precision-recall curve and auc
from sklearn.datasets import make_classification
from sklearn.neighbors import KNeighborsClassifier
from sklearn.model_selection import train_test_split
from sklearn.metrics import precision_recall_curve
from sklearn.metrics import f1_score
from sklearn.metrics import auc
from sklearn.metrics import average_precision_score
from matplotlib import pyplot
# generate 2 class dataset
X, y = make_classification(n_samples=1000, n_classes=2, weights=[0.9,0.09], random_state=1)
# split into train/test sets
trainX, testX, trainy, testy = train_test_split(X, y, test_size=0.5, random_state=2)
# fit a model
model = KNeighborsClassifier(n_neighbors=3)
model.fit(trainX, trainy)
# predict probabilities
probs = model.predict_proba(testX)
# keep probabilities for the positive outcome only
probs = probs[:, 1]
# predict class values
yhat = model.predict(testX)
# calculate precision-recall curve
precision, recall, thresholds = precision_recall_curve(testy, probs)
# calculate F1 score
f1 = f1_score(testy, yhat)
# calculate precision-recall AUC
auc = auc(recall, precision)
# calculate average precision score
ap = average_precision_score(testy, probs)
print('f1=%.3f auc=%.3f ap=%.3f' % (f1, auc, ap))
# plot no skill
pyplot.plot([0, 1], [0.1, 0.1], linestyle='--')
# plot the roc curve for the model
pyplot.plot(recall, precision, marker='.')
# show the plot
pyplot.show()

Running the example first prints the F1, AUC and AP scores.

The scores do not look encouraging, given skilful models are generally above 0.5.

f1=0.278 auc=0.302 ap=0.236

From the plot, we can see that after precision and recall crash fast.

Line Plot of Precision-Recall Curve Imbalanced Dataset

Line Plot of Precision-Recall Curve Imbalanced Dataset

Further Reading

This section provides more resources on the topic if you are looking to go deeper.

Papers

API

Articles

Summary

In this tutorial, you discovered ROC Curves, Precision-Recall Curves, and when to use each to interpret the prediction of probabilities for binary classification problems.

Specifically, you learned:

  • ROC Curves summarize the trade-off between the true positive rate and false positive rate for a predictive model using different probability thresholds.
  • Precision-Recall curves summarize the trade-off between the true positive rate and the positive predictive value for a predictive model using different probability thresholds.
  • ROC curves are appropriate when the observations are balanced between each class, whereas precision-recall curves are appropriate for imbalanced datasets.

Do you have any questions?
Ask your questions in the comments below and I will do my best to answer.

The post How and When to Use ROC Curves and Precision-Recall Curves for Classification in Python appeared first on Machine Learning Mastery.


How and When to Use a Calibrated Classification Model with scikit-learn

$
0
0

Instead of predicting class values directly for a classification problem, it can be convenient to predict the probability of an observation belonging to each possible class.

Predicting probabilities allows some flexibility including deciding how to interpret the probabilities, presenting predictions with uncertainty, and providing more nuanced ways to evaluate the skill of the model.

Predicted probabilities that match the expected distribution of probabilities for each class are referred to as calibrated. The problem is, not all machine learning models are capable of predicting calibrated probabilities.

There are methods to both diagnose how calibrated predicted probabilities are and to better calibrate the predicted probabilities with the observed distribution of each class. Often, this can lead to better quality predictions, depending on how the skill of the model is evaluated.

In this tutorial, you will discover the importance of calibrating predicted probabilities and how to diagnose and improve the calibration of models used for probabilistic classification.

After completing this tutorial, you will know:

  • Nonlinear machine learning algorithms often predict uncalibrated class probabilities.
  • Reliability diagrams can be used to diagnose the calibration of a model, and methods can be used to better calibrate predictions for a problem.
  • How to develop reliability diagrams and calibrate classification models in Python with scikit-learn.

Let’s get started.

How and When to Use a Calibrated Classification Model with scikit-learn

How and When to Use a Calibrated Classification Model with scikit-learn
Photo by Nigel Howe, some rights reserved.

Tutorial Overview

This tutorial is divided into four parts; they are:

  1. Predicting Probabilities
  2. Calibration of Predictions
  3. How to Calibrate Probabilities in Python
  4. Worked Example of Calibrating SVM Probabilities

Predicting Probabilities

A classification predictive modeling problem requires predicting or forecasting a label for a given observation.

An alternative to predicting the label directly, a model may predict the probability of an observation belonging to each possible class label.

This provides some flexibility both in the way predictions are interpreted and presented (choice of threshold and prediction uncertainty) and in the way the model is evaluated.

Although a model may be able to predict probabilities, the distribution and behavior of the probabilities may not match the expected distribution of observed probabilities in the training data.

This is especially common with complex nonlinear machine learning algorithms that do not directly make probabilistic predictions and instead use approximations.

The distribution of the probabilities can be adjusted to better match the expected distribution observed in the data. This adjustment is referred to as calibration, as in the calibration of the model or the calibration of the distribution of class probabilities.

[…] we desire that the estimated class probabilities are reflective of the true underlying probability of the sample. That is, the predicted class probability (or probability-like value) needs to be well-calibrated. To be well-calibrated, the probabilities must effectively reflect the true likelihood of the event of interest.

— Page 249, Applied Predictive Modeling, 2013.

Calibration of Predictions

There are two concerns in calibrating probabilities; they are diagnosing the calibration of predicted probabilities and the calibration process itself.

Reliability Diagrams (Calibration Curves)

A reliability diagram is a line plot of the relative frequency of what was observed (y-axis) versus the predicted probability frequency  (x-axis).

Reliability diagrams are common aids for illustrating the properties of probabilistic forecast systems. They consist of a plot of the observed relative frequency against the predicted probability, providing a quick visual intercomparison when tuning probabilistic forecast systems, as well as documenting the performance of the final product

Increasing the Reliability of Reliability Diagrams, 2007.

Specifically, the predicted probabilities are divided up into a fixed number of buckets along the x-axis. The number of events (class=1) are then counted for each bin (e.g. the relative observed frequency). Finally, the counts are normalized. The results are then plotted as a line plot.

These plots are commonly referred to as ‘reliability‘ diagrams in forecast literature, although may also be called ‘calibration‘ plots or curves as they summarize how well the forecast probabilities are calibrated.

The better calibrated or more reliable a forecast, the closer the points will appear along the main diagonal from the bottom left to the top right of the plot.

The position of the points or the curve relative to the diagonal can help to interpret the probabilities; for example:

  • Below the diagonal: The model has over-forecast; the probabilities are too large.
  • Above the diagonal: The model has under-forecast; the probabilities are too small.

Probabilities, by definition, are continuous, so we expect some separation from the line, often shown as an S-shaped curve showing pessimistic tendencies over-forecasting low probabilities and under-forecasting high probabilities.

Reliability diagrams provide a diagnostic to check whether the forecast value Xi is reliable. Roughly speaking, a probability forecast is reliable if the event actually happens with an observed relative frequency consistent with the forecast value.

Increasing the Reliability of Reliability Diagrams, 2007.

The reliability diagram can help to understand the relative calibration of the forecasts from different predictive models.

Probability Calibration

The predictions made by a predictive model can be calibrated.

Calibrated predictions may (or may not) result in an improved calibration on a reliability diagram.

Some algorithms are fit in such a way that their predicted probabilities are already calibrated. Without going into details why, logistic regression is one such example.

Other algorithms do not directly produce predictions of probabilities, and instead a prediction of probabilities must be approximated. Some examples include neural networks, support vector machines, and decision trees.

The predicted probabilities from these methods will likely be uncalibrated and may benefit from being modified via calibration.

Calibration of prediction probabilities is a rescaling operation that is applied after the predictions have been made by a predictive model.

There are two popular approaches to calibrating probabilities; they are the Platt Scaling and Isotonic Regression.

Platt Scaling is simpler and is suitable for reliability diagrams with the S-shape. Isotonic Regression is more complex, requires a lot more data (otherwise it may overfit), but can support reliability diagrams with different shapes (is nonparametric).

Platt Scaling is most effective when the distortion in the predicted probabilities is sigmoid-shaped. Isotonic Regression is a more powerful calibration method that can correct any monotonic distortion. Unfortunately, this extra power comes at a price. A learning curve analysis shows that Isotonic Regression is more prone to overfitting, and thus performs worse than Platt Scaling, when data is scarce.

Predicting Good Probabilities With Supervised Learning, 2005.

Note, and this is really important: better calibrated probabilities may or may not lead to better class-based or probability-based predictions. It really depends on the specific metric used to evaluate predictions.

In fact, some empirical results suggest that the algorithms that can benefit the more from calibrating predicted probabilities include SVMs, bagged decision trees, and random forests.

[…] after calibration the best methods are boosted trees, random forests and SVMs.

Predicting Good Probabilities With Supervised Learning, 2005.

How to Calibrate Probabilities in Python

The scikit-learn machine learning library allows you to both diagnose the probability calibration of a classifier and calibrate a classifier that can predict probabilities.

Diagnose Calibration

You can diagnose the calibration of a classifier by creating a reliability diagram of the actual probabilities versus the predicted probabilities on a test set.

In scikit-learn, this is called a calibration curve.

This can be implemented by first calculating the calibration_curve() function. This function takes the true class values for a dataset and the predicted probabilities for the main class (class=1). The function returns the true probabilities for each bin and the predicted probabilities for each bin. The number of bins can be specified via the n_bins argument and default to 5.

For example, below is a code snippet showing the API usage:

...
# predict probabilities
probs = model.predic_proba(testX)[:,1]
# reliability diagram
fop, mpv = calibration_curve(testy, probs, n_bins=10)
# plot perfectly calibrated
pyplot.plot([0, 1], [0, 1], linestyle='--')
# plot model reliability
pyplot.plot(mpv, fop, marker='.')
pyplot.show()

Calibrate Classifier

A classifier can be calibrated in scikit-learn using the CalibratedClassifierCV class.

There are two ways to use this class: prefit and cross-validation.

You can fit a model on a training dataset and calibrate this prefit model using a hold out validation dataset.

For example, below is a code snippet showing the API usage:

...
# prepare data
trainX, trainy = ...
valX, valy = ...
testX, testy = ...
# fit base model on training dataset
model = ...
model.fit(trainX, trainy)
# calibrate model on validation data
calibrator = CalibratedClassifierCV(model, cv='prefit')
calibrator.fit(valX, valy)
# evaluate the model
yhat = calibrator.predict(testX)

Alternately, the CalibratedClassifierCV can fit multiple copies of the model using k-fold cross-validation and calibrate the probabilities predicted by these models using the hold out set. Predictions are made using each of the trained models.

For example, below is a code snippet showing the API usage:

...
# prepare data
trainX, trainy = ...
testX, testy = ...
# define base model
model = ...
# fit and calibrate model on training data
calibrator = CalibratedClassifierCV(model, cv=3)
calibrator.fit(trainX, trainy)
# evaluate the model
yhat = calibrator.predict(testX)

The CalibratedClassifierCV class supports two types of probability calibration; specifically, the parametric ‘sigmoid‘ method (Platt’s method) and the nonparametric ‘isotonic‘ method which can be specified via the ‘method‘ argument.

Worked Example of Calibrating SVM Probabilities

We can make the discussion of calibration concrete with some worked examples.

In these examples, we will fit a support vector machine (SVM) to a noisy binary classification problem and use the model to predict probabilities, then review the calibration using a reliability diagram and calibrate the classifier and review the result.

SVM is a good candidate model to calibrate because it does not natively predict probabilities, meaning the probabilities are often uncalibrated.

A note on SVM: probabilities can be predicted by calling the decision_function() function on the fit model instead of the usual predict_proba() function. The probabilities are not normalized, but can be normalized when calling the calibration_curve() function by setting the ‘normalize‘ argument to ‘True‘.

The example below fits an SVM model on the test problem, predicted probabilities, and plots the calibration of the probabilities as a reliability diagram,

# SVM reliability diagram
from sklearn.datasets import make_classification
from sklearn.svm import SVC
from sklearn.model_selection import train_test_split
from sklearn.calibration import calibration_curve
from matplotlib import pyplot
# generate 2 class dataset
X, y = make_classification(n_samples=1000, n_classes=2, weights=[1,1], random_state=1)
# split into train/test sets
trainX, testX, trainy, testy = train_test_split(X, y, test_size=0.5, random_state=2)
# fit a model
model = SVC()
model.fit(trainX, trainy)
# predict probabilities
probs = model.decision_function(testX)
# reliability diagram
fop, mpv = calibration_curve(testy, probs, n_bins=10, normalize=True)
# plot perfectly calibrated
pyplot.plot([0, 1], [0, 1], linestyle='--')
# plot model reliability
pyplot.plot(mpv, fop, marker='.')
pyplot.show()

Running the example creates a reliability diagram showing the calibration of the SVMs predicted probabilities (solid line) compared to a perfectly calibrated model along the diagonal of the plot (dashed line.)

We can see the expected S-shaped curve of a conservative forecast.

Uncalibrated SVM Reliability Diagram

Uncalibrated SVM Reliability Diagram

We can update the example to fit the SVM via the CalibratedClassifierCV class using 5-fold cross-validation, using the holdout sets to calibrate the predicted probabilities.

The complete example is listed below.

# SVM reliability diagram with calibration
from sklearn.datasets import make_classification
from sklearn.svm import SVC
from sklearn.calibration import CalibratedClassifierCV
from sklearn.model_selection import train_test_split
from sklearn.calibration import calibration_curve
from matplotlib import pyplot
# generate 2 class dataset
X, y = make_classification(n_samples=1000, n_classes=2, weights=[1,1], random_state=1)
# split into train/test sets
trainX, testX, trainy, testy = train_test_split(X, y, test_size=0.5, random_state=2)
# fit a model
model = SVC()
calibrated = CalibratedClassifierCV(model, method='sigmoid', cv=5)
calibrated.fit(trainX, trainy)
# predict probabilities
probs = calibrated.predict_proba(testX)[:, 1]
# reliability diagram
fop, mpv = calibration_curve(testy, probs, n_bins=10, normalize=True)
# plot perfectly calibrated
pyplot.plot([0, 1], [0, 1], linestyle='--')
# plot calibrated reliability
pyplot.plot(mpv, fop, marker='.')
pyplot.show()

Running the example creates a reliability diagram for the calibrated probabilities.

The shape of the calibrated probabilities is different, hugging the diagonal line much better, although still under-forecasting in the upper quadrant.

Visually, the plot suggests a better calibrated model.

Calibrated SVM Reliability Diagram

Calibrated SVM Reliability Diagram

We can make the contrast between the two models more obvious by including both reliability diagrams on the same plot.

The complete example is listed below.

# SVM reliability diagrams with uncalibrated and calibrated probabilities
from sklearn.datasets import make_classification
from sklearn.svm import SVC
from sklearn.calibration import CalibratedClassifierCV
from sklearn.model_selection import train_test_split
from sklearn.calibration import calibration_curve
from matplotlib import pyplot

# predict uncalibrated probabilities
def uncalibrated(trainX, testX, trainy):
	# fit a model
	model = SVC()
	model.fit(trainX, trainy)
	# predict probabilities
	return model.decision_function(testX)

# predict calibrated probabilities
def calibrated(trainX, testX, trainy):
	# define model
	model = SVC()
	# define and fit calibration model
	calibrated = CalibratedClassifierCV(model, method='sigmoid', cv=5)
	calibrated.fit(trainX, trainy)
	# predict probabilities
	return calibrated.predict_proba(testX)[:, 1]

# generate 2 class dataset
X, y = make_classification(n_samples=1000, n_classes=2, weights=[1,1], random_state=1)
# split into train/test sets
trainX, testX, trainy, testy = train_test_split(X, y, test_size=0.5, random_state=2)
# uncalibrated predictions
yhat_uncalibrated = uncalibrated(trainX, testX, trainy)
# calibrated predictions
yhat_calibrated = calibrated(trainX, testX, trainy)
# reliability diagrams
fop_uncalibrated, mpv_uncalibrated = calibration_curve(testy, yhat_uncalibrated, n_bins=10, normalize=True)
fop_calibrated, mpv_calibrated = calibration_curve(testy, yhat_calibrated, n_bins=10)
# plot perfectly calibrated
pyplot.plot([0, 1], [0, 1], linestyle='--', color='black')
# plot model reliabilities
pyplot.plot(mpv_uncalibrated, fop_uncalibrated, marker='.')
pyplot.plot(mpv_calibrated, fop_calibrated, marker='.')
pyplot.show()

Running the example creates a single reliability diagram showing both the calibrated (orange) and uncalibrated (blue) probabilities.

It is not really an apples-to-apples comparison as the predictions made by the calibrated model are in fact a combination of five submodels.

Nevertheless, we do see a marked difference in the reliability of the calibrated probabilities (very likely caused by the calibration process).

Calibrated and Uncalibrated SVM Reliability Diagram

Calibrated and Uncalibrated SVM Reliability Diagram

Further Reading

This section provides more resources on the topic if you are looking to go deeper.

Books and Papers

API

Articles

Summary

In this tutorial, you discovered the importance of calibrating predicted probabilities and how to diagnose and improve the calibration of models used for probabilistic classification.

Specifically, you learned:

  • Nonlinear machine learning algorithms often predict uncalibrated class probabilities.
  • Reliability diagrams can be used to diagnose the calibration of a model, and methods can be used to better calibrate predictions for a problem.
  • How to develop reliability diagrams and calibrate classification models in Python with scikit-learn.

Do you have any questions?
Ask your questions in the comments below and I will do my best to answer.

The post How and When to Use a Calibrated Classification Model with scikit-learn appeared first on Machine Learning Mastery.

A Gentle Introduction to Probability Scoring Methods in Python

$
0
0

How to Score Probability Predictions in Python and
Develop an Intuition for Different Metrics.

Predicting probabilities instead of class labels for a classification problem can provide additional nuance and uncertainty for the predictions.

The added nuance allows more sophisticated metrics to be used to interpret and evaluate the predicted probabilities. In general, methods for the evaluation of the accuracy of predicted probabilities are referred to as scoring rules or scoring functions.

In this tutorial, you will discover three scoring methods that you can use to evaluate the predicted probabilities on your classification predictive modeling problem.

After completing this tutorial, you will know:

  • The log loss score that heavily penalizes predicted probabilities far away from their expected value.
  • The Brier score that is gentler than log loss but still penalizes proportional to the distance from the expected value.
  • The area under ROC curve that summarizes the likelihood of the model predicting a higher probability for true positive cases than true negative cases.

Let’s get started.

  • Update Sept/2018: Fixed description of AUC no skill.
A Gentle Introduction to Probability Scoring Methods in Python

A Gentle Introduction to Probability Scoring Methods in Python
Photo by Paul Balfe, some rights reserved.

Tutorial Overview

This tutorial is divided into four parts; they are:

  1. Log Loss Score
  2. Brier Score
  3. ROC AUC Score
  4. Tuning Predicted Probabilities

Log Loss Score

Log loss, also called “logistic loss,” “logarithmic loss,” or “cross entropy” can be used as a measure for evaluating predicted probabilities.

Each predicted probability is compared to the actual class output value (0 or 1) and a score is calculated that penalizes the probability based on the distance from the expected value. The penalty is logarithmic, offering a small score for small differences (0.1 or 0.2) and enormous score for a large difference (0.9 or 1.0).

A model with perfect skill has a log loss score of 0.0.

In order to summarize the skill of a model using log loss, the log loss is calculated for each predicted probability, and the average loss is reported.

The log loss can be implemented in Python using the log_loss() function in scikit-learn.

For example:

from sklearn.metrics import log_loss
...
model = ...
testX, testy = ...
# predict probabilities
probs = model.predict_proba(testX)
# keep the predictions for class 1 only
probs = probs[:, 1]
# calculate log loss
loss = log_loss(testy, probs)

In the binary classification case, the function takes a list of true outcome values and a list of probabilities as arguments and calculates the average log loss for the predictions.

We can make a single log loss score concrete with an example.

Given a specific known outcome of 0, we can predict values of 0.0 to 1.0 in 0.01 increments (101 predictions) and calculate the log loss for each. The result is a curve showing how much each prediction is penalized as the probability gets further away from the expected value. We can repeat this for a known outcome of 1 and see the same curve in reverse.

The complete example is listed below.

# plot impact of logloss for single forecasts
from sklearn.metrics import log_loss
from matplotlib import pyplot
from numpy import array
# predictions as 0 to 1 in 0.01 increments
yhat = [x*0.01 for x in range(0, 101)]
# evaluate predictions for a 0 true value
losses_0 = [log_loss([0], [x], labels=[0,1]) for x in yhat]
# evaluate predictions for a 1 true value
losses_1 = [log_loss([1], [x], labels=[0,1]) for x in yhat]
# plot input to loss
pyplot.plot(yhat, losses_0, label='true=0')
pyplot.plot(yhat, losses_1, label='true=1')
pyplot.legend()
pyplot.show()

Running the example creates a line plot showing the loss scores for probability predictions from 0.0 to 1.0 for both the case where the true label is 0 and 1.

This helps to build an intuition for the effect that the loss score has when evaluating predictions.

Line Plot of Evaluating Predictions with Log Loss

Line Plot of Evaluating Predictions with Log Loss

Model skill is reported as the average log loss across the predictions in a test dataset.

As an average, we can expect that the score will be suitable with a balanced dataset and misleading when there is a large imbalance between the two classes in the test set. This is because predicting 0 or small probabilities will result in a small loss.

We can demonstrate this by comparing the distribution of loss values when predicting different constant probabilities for a balanced and an imbalanced dataset.

First, the example below predicts values from 0.0 to 1.0 in 0.1 increments for a balanced dataset of 50 examples of class 0 and 1.

# plot impact of logloss with balanced datasets
from sklearn.metrics import log_loss
from matplotlib import pyplot
from numpy import array
# define an imbalanced dataset
testy = [0 for x in range(50)] + [1 for x in range(50)]
# loss for predicting different fixed probability values
predictions = [0.0, 0.1, 0.2, 0.3, 0.4, 0.5, 0.6, 0.7, 0.8, 0.9, 1.0]
losses = [log_loss(testy, [y for x in range(len(testy))]) for y in predictions]
# plot predictions vs loss
pyplot.plot(predictions, losses)
pyplot.show()

Running the example, we can see that a model is better-off predicting probabilities values that are not sharp (close to the edge) and are back towards the middle of the distribution.

The penalty of being wrong with a sharp probability is very large.

Line Plot of Predicting Log Loss for Balanced Dataset

Line Plot of Predicting Log Loss for Balanced Dataset

We can repeat this experiment with an imbalanced dataset with a 10:1 ratio of class 0 to class 1.

# plot impact of logloss with imbalanced datasets
from sklearn.metrics import log_loss
from matplotlib import pyplot
from numpy import array
# define an imbalanced dataset
testy = [0 for x in range(100)] + [1 for x in range(10)]
# loss for predicting different fixed probability values
predictions = [0.0, 0.1, 0.2, 0.3, 0.4, 0.5, 0.6, 0.7, 0.8, 0.9, 1.0]
losses = [log_loss(testy, [y for x in range(len(testy))]) for y in predictions]
# plot predictions vs loss
pyplot.plot(predictions, losses)
pyplot.show()

Here, we can see that a model that is skewed towards predicting very small probabilities will perform well, optimistically so.

The naive model that predicts a constant probability of 0.1 will be the baseline model to beat.

The result suggests that model skill evaluated with log loss should be interpreted carefully in the case of an imbalanced dataset, perhaps adjusted relative to the base rate for class 1 in the dataset.

Line Plot of Predicting Log Loss for Imbalanced Dataset

Line Plot of Predicting Log Loss for Imbalanced Dataset

Brier Score

The Brier score, named for Glenn Brier, calculates the mean squared error between predicted probabilities and the expected values.

The score summarizes the magnitude of the error in the probability forecasts.

The error score is always between 0.0 and 1.0, where a model with perfect skill has a score of 0.0.

Predictions that are further away from the expected probability are penalized, but less severely as in the case of log loss.

The skill of a model can be summarized as the average Brier score across all probabilities predicted for a test dataset.

The Brier score can be calculated in Python using the brier_score_loss() function in scikit-learn. It takes the true class values (0, 1) and the predicted probabilities for all examples in a test dataset as arguments and returns the average Brier score.

For example:

from sklearn.metrics import brier_score_loss
...
model = ...
testX, testy = ...
# predict probabilities
probs = model.predict_proba(testX)
# keep the predictions for class 1 only
probs = probs[:, 1]
# calculate bier score
loss = brier_score_loss(testy, probs)

We can evaluate the impact of prediction errors by comparing the Brier score for single probability forecasts in increasing error from 0.0 to 1.0.

The complete example is listed below.

# plot impact of brier for single forecasts
from sklearn.metrics import brier_score_loss
from matplotlib import pyplot
from numpy import array
# predictions as 0 to 1 in 0.01 increments
yhat = [x*0.01 for x in range(0, 101)]
# evaluate predictions for a 1 true value
losses = [brier_score_loss([1], [x], pos_label=[1]) for x in yhat]
# plot input to loss
pyplot.plot(yhat, losses)
pyplot.show()

Running the example creates a plot of the probability prediction error in absolute terms (x-axis) to the calculated Brier score (y axis).

We can see a familiar quadratic curve, increasing from 0 to 1 with the squared error.

Line Plot of Evaluating Predictions with Brier Score

Line Plot of Evaluating Predictions with Brier Score

Model skill is reported as the average Brier across the predictions in a test dataset.

As with log loss, we can expect that the score will be suitable with a balanced dataset and misleading when there is a large imbalance between the two classes in the test set.

We can demonstrate this by comparing the distribution of loss values when predicting different constant probabilities for a balanced and an imbalanced dataset.

First, the example below predicts values from 0.0 to 1.0 in 0.1 increments for a balanced dataset of 50 examples of class 0 and 1.

# plot impact of brier score with balanced datasets
from sklearn.metrics import brier_score_loss
from matplotlib import pyplot
from numpy import array
# define an imbalanced dataset
testy = [0 for x in range(50)] + [1 for x in range(50)]
# brier score for predicting different fixed probability values
predictions = [0.0, 0.1, 0.2, 0.3, 0.4, 0.5, 0.6, 0.7, 0.8, 0.9, 1.0]
losses = [brier_score_loss(testy, [y for x in range(len(testy))]) for y in predictions]
# plot predictions vs loss
pyplot.plot(predictions, losses)
pyplot.show()

Running the example, we can see that a model is better-off predicting middle of the road probabilities values like 0.5.

Unlike log loss that is quite flat for close probabilities, the parabolic shape shows the clear quadratic increase in the score penalty as the error is increased.

Line Plot of Predicting Brier Score for Balanced Dataset

Line Plot of Predicting Brier Score for Balanced Dataset

We can repeat this experiment with an imbalanced dataset with a 10:1 ratio of class 0 to class 1.

# plot impact of brier score with imbalanced datasets
from sklearn.metrics import brier_score_loss
from matplotlib import pyplot
from numpy import array
# define an imbalanced dataset
testy = [0 for x in range(100)] + [1 for x in range(10)]
# brier score for predicting different fixed probability values
predictions = [0.0, 0.1, 0.2, 0.3, 0.4, 0.5, 0.6, 0.7, 0.8, 0.9, 1.0]
losses = [brier_score_loss(testy, [y for x in range(len(testy))]) for y in predictions]
# plot predictions vs loss
pyplot.plot(predictions, losses)
pyplot.show()

Running the example, we see a very different picture for the imbalanced dataset.

Like the average log loss, the average Brier score will present optimistic scores on an imbalanced dataset, rewarding small prediction values that reduce error on the majority class.

In these cases, Brier score should be compared relative to the naive prediction (e.g. the base rate of the minority class or 0.1 in the above example) or normalized by the naive score.

This latter example is common and is called the Brier Skill Score (BSS).

BSS = 1 - (BS / BS_ref)

Where BS is the Brier skill of model, and BS_ref is the Brier skill of the naive prediction.

The Brier Skill Score reports the relative skill of the probability prediction over the naive forecast.

A good update to the scikit-learn API would be to add a parameter to the brier_score_loss() to support the calculation of the Brier Skill Score.

Line Plot of Predicting Log Loss for Imbalanced Dataset

Line Plot of Predicting Brier Score for Imbalanced Dataset

ROC AUC Score

A predicted probability for a binary (two-class) classification problem can be interpreted with a threshold.

The threshold defines the point at which the probability is mapped to class 0 versus class 1, where the default threshold is 0.5. Alternate threshold values allow the model to be tuned for higher or lower false positives and false negatives.

Tuning the threshold by the operator is particularly important on problems where one type of error is more or less important than another or when a model is makes disproportionately more or less of a specific type of error.

The Receiver Operating Characteristic, or ROC, curve is a plot of the true positive rate versus the false positive rate for the predictions of a model for multiple thresholds between 0.0 and 1.0.

Predictions that have no skill for a given threshold are drawn on the diagonal of the plot from the bottom left to the top right. This line represents no-skill predictions for each threshold.

Models that have skill have a curve above this diagonal line that bows towards the top left corner.

Below is an example of fitting a logistic regression model on a binary classification problem and calculating and plotting the ROC curve for the predicted probabilities on a test set of 500 new data instances.

# roc curve
from sklearn.datasets import make_classification
from sklearn.linear_model import LogisticRegression
from sklearn.model_selection import train_test_split
from sklearn.metrics import roc_curve
from matplotlib import pyplot
# generate 2 class dataset
X, y = make_classification(n_samples=1000, n_classes=2, random_state=1)
# split into train/test sets
trainX, testX, trainy, testy = train_test_split(X, y, test_size=0.5, random_state=2)
# fit a model
model = LogisticRegression()
model.fit(trainX, trainy)
# predict probabilities
probs = model.predict_proba(testX)
# keep probabilities for the positive outcome only
probs = probs[:, 1]
# calculate roc curve
fpr, tpr, thresholds = roc_curve(testy, probs)
# plot no skill
pyplot.plot([0, 1], [0, 1], linestyle='--')
# plot the roc curve for the model
pyplot.plot(fpr, tpr)
# show the plot
pyplot.show()

Running the example creates an example of a ROC curve that can be compared to the no skill line on the main diagonal.

Example ROC Curve

Example ROC Curve

The integrated area under the ROC curve, called AUC or ROC AUC, provides a measure of the skill of the model across all evaluated thresholds.

An AUC score of 0.5 suggests no skill, e.g. a curve along the diagonal, whereas an AUC of 1.0 suggests perfect skill, all points along the left y-axis and top x-axis toward the top left corner. An AUC of 0.0 suggests perfectly incorrect predictions.

Predictions by models that have a larger area have better skill across the thresholds, although the specific shape of the curves between models will vary, potentially offering opportunity to optimize models by a pre-chosen threshold. Typically, the threshold is chosen by the operator after the model has been prepared.

The AUC can be calculated in Python using the roc_auc_score() function in scikit-learn.

This function takes a list of true output values and predicted probabilities as arguments and returns the ROC AUC.

For example:

from sklearn.metrics import roc_auc_score
...
model = ...
testX, testy = ...
# predict probabilities
probs = model.predict_proba(testX)
# keep the predictions for class 1 only
probs = probs[:, 1]
# calculate log loss
loss = roc_auc_score(testy, probs)

An AUC score is a measure of the likelihood that the model that produced the predictions will rank a randomly chosen positive example above a randomly chosen negative example. Specifically, that the probability will be higher for a real event (class=1) than a real non-event (class=0).

This is an instructive definition that offers two important intuitions:

  • Naive Prediction. A naive prediction under ROC AUC is any constant probability. If the same probability is predicted for every example, there is no discrimination between positive and negative cases, therefore the model has no skill (AUC=0.5).
  • Insensitivity to Class Imbalance. ROC AUC is a summary on the models ability to correctly discriminate a single example across different thresholds. As such, it is unconcerned with the base likelihood of each class.

Below, the example demonstrating the ROC curve is updated to calculate and display the AUC.

# roc auc
from sklearn.datasets import make_classification
from sklearn.linear_model import LogisticRegression
from sklearn.model_selection import train_test_split
from sklearn.metrics import roc_auc_score
from matplotlib import pyplot
# generate 2 class dataset
X, y = make_classification(n_samples=1000, n_classes=2, random_state=1)
# split into train/test sets
trainX, testX, trainy, testy = train_test_split(X, y, test_size=0.5, random_state=2)
# fit a model
model = LogisticRegression()
model.fit(trainX, trainy)
# predict probabilities
probs = model.predict_proba(testX)
# keep probabilities for the positive outcome only
probs = probs[:, 1]
# calculate roc auc
auc = roc_auc_score(testy, probs)
print(auc)

Running the example calculates and prints the ROC AUC for the logistic regression model evaluated on 500 new examples.

0.9028044871794871

An important consideration in choosing the ROC AUC is that it does not summarize the specific discriminative power of the model, rather the general discriminative power across all thresholds.

It might be a better tool for model selection rather than in quantifying the practical skill of a model’s predicted probabilities.

Tuning Predicted Probabilities

Predicted probabilities can be tuned to improve or even game a performance measure.

For example, the log loss and Brier scores quantify the average amount of error in the probabilities. As such, predicted probabilities can be tuned to improve these scores in a few ways:

  • Making the probabilities less sharp (less confident). This means adjusting the predicted probabilities away from the hard 0 and 1 bounds to limit the impact of penalties of being completely wrong.
  • Shift the distribution to the naive prediction (base rate). This means shifting the mean of the predicted probabilities to the probability of the base rate, such as 0.5 for a balanced prediction problem.

Generally, it may be useful to review the calibration of the probabilities using tools like a reliability diagram. This can be achieved using the calibration_curve() function in scikit-learn.

Some algorithms, such as SVM and neural networks, may not predict calibrated probabilities natively. In these cases, the probabilities can be calibrated and in turn may improve the chosen metric. Classifiers can be calibrated in scikit-learn using the CalibratedClassifierCV class.

Further Reading

This section provides more resources on the topic if you are looking to go deeper.

API

Articles

Summary

In this tutorial, you discovered three metrics that you can use to evaluate the predicted probabilities on your classification predictive modeling problem.

Specifically, you learned:

  • The log loss score that heavily penalizes predicted probabilities far away from their expected value.
  • The Brier score that is gentler than log loss but still penalizes proportional to the distance from the expected value
  • The area under ROC curve that summarizes the likelihood of the model predicting a higher probability for true positive cases than true negative cases.

Do you have any questions?
Ask your questions in the comments below and I will do my best to answer.

The post A Gentle Introduction to Probability Scoring Methods in Python appeared first on Machine Learning Mastery.

How to Develop a Reusable Framework to Spot-Check Algorithms in Python

$
0
0

Spot-checking algorithms is a technique in applied machine learning designed to quickly and objectively provide a first set of results on a new predictive modeling problem.

Unlike grid searching and other types of algorithm tuning that seek the optimal algorithm or optimal configuration for an algorithm, spot-checking is intended to evaluate a diverse set of algorithms rapidly and provide a rough first-cut result. This first cut result may be used to get an idea if a problem or problem representation is indeed predictable, and if so, the types of algorithms that may be worth investigating further for the problem.

Spot-checking is an approach to help overcome the “hard problem” of applied machine learning and encourage you to clearly think about the higher-order search problem being performed in any machine learning project.

In this tutorial, you will discover the usefulness of spot-checking algorithms on a new predictive modeling problem and how to develop a standard framework for spot-checking algorithms in python for classification and regression problems.

After completing this tutorial, you will know:

  • Spot-checking provides a way to quickly discover the types of algorithms that perform well on your predictive modeling problem.
  • How to develop a generic framework for loading data, defining models, evaluating models, and summarizing results.
  • How to apply the framework for classification and regression problems.

Let’s get started.

How to Develop a Reusable Framework for Spot-Check Algorithms in Python

How to Develop a Reusable Framework for Spot-Check Algorithms in Python
Photo by Jeff Turner, some rights reserved.

Tutorial Overview

This tutorial is divided into five parts; they are:

  1. Spot-Check Algorithms
  2. Spot-Checking Framework in Python
  3. Spot-Checking for Classification
  4. Spot-Checking for Regression
  5. Framework Extension

1. Spot-Check Algorithms

We cannot know beforehand what algorithms will perform well on a given predictive modeling problem.

This is the hard part of applied machine learning that can only be resolved via systematic experimentation.

Spot-checking is an approach to this problem.

It involves rapidly testing a large suite of diverse machine learning algorithms on a problem in order to quickly discover what algorithms might work and where to focus attention.

  • It is fast; it by-passes the days or weeks of preparation and analysis and playing with algorithms that may not ever lead to a result.
  • It is objective, allowing you to discover what might work well for a problem rather than going with what you used last time.
  • It gets results; you will actually fit models, make predictions and know if your problem can be predicted and what baseline skill may look like.

Spot-checking may require that you work with a small sample of your dataset in order to turn around results quickly.

Finally, the results from spot checking are a jumping-off point. A starting point. They suggest where to focus attention on the problem, not what the best algorithm might be. The process is designed to shake you out of typical thinking and analysis and instead focus on results.

You can learn more about spot-checking in the post:

Now that we know what spot-checking is, let’s look at how we can systematically perform spot-checking in Python.

2. Spot-Checking Framework in Python

In this section we will build a framework for a script that can be used for spot-checking machine learning algorithms on a classification or regression problem.

There are four parts to the framework that we need to develop; they are:

  • Load Dataset
  • Define Models
  • Evaluate Models
  • Summarize Results

Let’s take a look at each in turn.

Load Dataset

The first step of the framework is to load the data.

The function must be implemented for a given problem and be specialized to that problem. It will likely involve loading data from one or more CSV files.

We will call this function load_data(); it will take no arguments and return the inputs (X) and outputs (y) for the prediction problem.

# load the dataset, returns X and y elements
def load_dataset():
	X, y = None, None
	return X, y

Define Models

The next step is to define the models to evaluate on the predictive modeling problem.

The models defined will be specific to the type predictive modeling problem, e.g. classification or regression.

The defined models should be diverse, including a mixture of:

  • Linear Models.
  • Nonlinear Models.
  • Ensemble Models.

Each model should be a given a good chance to perform well on the problem. This might be mean providing a few variations of the model with different common or well known configurations that perform well on average.

We will call this function define_models(). It will return a dictionary of model names mapped to scikit-learn model object. The name should be short, like ‘svm‘ and may include a configuration detail, e.g. ‘knn-7’.

The function will also take a dictionary as an optional argument; if not provided, a new dictionary is created and populated. If a dictionary is provided, models are added to it.

This is to add flexibility if you would like to have multiple functions for defining models, or add a large number of models of a specific type with different configurations.

# create a dict of standard models to evaluate {name:object}
def define_models(models=dict()):
	# ...
	return models

The idea is not to grid search model parameters; that can come later.

Instead, each model should be given an opportunity to perform well (i.e. not optimally). This might mean trying many combinations of parameters in some cases, e.g. in the case of gradient boosting.

Evaluate Models

The next step is the evaluation of the defined models on the loaded dataset.

The scikit-learn library provides the ability to pipeline models during evaluation. This allows the data to be transformed prior to being used to fit a model, and this is done in a correct way such that the transforms are prepared on the training data and applied to the test data.

We can define a function that prepares a given model prior to evaluation to allow specific transforms to be used during the spot checking process. They will be performed in a blanket way to all models. This can be useful to perform operations such as standardization, normalization, and feature selection.

We will define a function named make_pipeline() that takes a defined model and returns a pipeline. Below is an example of preparing a pipeline that will first standardize the input data, then normalize it prior to fitting the model.

# create a feature preparation pipeline for a model
def make_pipeline(model):
	steps = list()
	# standardization
	steps.append(('standardize', StandardScaler()))
	# normalization
	steps.append(('normalize', MinMaxScaler()))
	# the model
	steps.append(('model', model))
	# create pipeline
	pipeline = Pipeline(steps=steps)
	return pipeline

This function can be expanded to add other transforms, or simplified to return the provided model with no transforms.

Now we need to evaluate a prepared model.

We will use a standard of evaluating models using k-fold cross-validation. The evaluation of each defined model will result in a list of results. This is because 10 different versions of the model will have been fit and evaluated, resulting in a list of k scores.

We will define a function named evaluate_model() that will take the data, a defined model, a number of folds, and a performance metric used to evaluate the results. It will return the list of scores.

The function calls make_pipeline() for the defined model to prepare any data transforms required, then calls the cross_val_score() scikit-learn function. Importantly, the n_jobs argument is set to -1 to allow the model evaluations to occur in parallel, harnessing as many cores as you have available on your hardware.

# evaluate a single model
def evaluate_model(X, y, model, folds, metric):
	# create the pipeline
	pipeline = make_pipeline(model)
	# evaluate model
	scores = cross_val_score(pipeline, X, y, scoring=metric, cv=folds, n_jobs=-1)
	return scores

It is possible for the evaluation of a model to fail with an exception. I have seen this especially in the case of some models from the statsmodels library.

It is also possible for the evaluation of a model to result in a lot of warning messages. I have seen this especially in the case of using XGBoost models.

We do not care about exceptions or warnings when spot checking. We only want to know what does work and what works well. Therefore, we can trap exceptions and ignore all warnings when evaluating each model.

The function named robust_evaluate_model() implements this behavior. The evaluate_model() is called in a way that traps exceptions and ignores warnings. If an exception occurs and no result was possible for a given model, a None result is returned.

# evaluate a model and try to trap errors and and hide warnings
def robust_evaluate_model(X, y, model, folds, metric):
	scores = None
	try:
		with warnings.catch_warnings():
			warnings.filterwarnings("ignore")
			scores = evaluate_model(X, y, model, folds, metric)
	except:
		scores = None
	return scores

Finally, we can define the top-level function for evaluating the list of defined models.

We will define a function named evaluate_models() that takes the dictionary of models as an argument and returns a dictionary of model names to lists of results.

The number of folds in the cross-validation process can be specified by an optional argument that defaults to 10. The metric calculated on the predictions from the model can also be specified by an optional argument and defaults to classification accuracy.

For a full list of supported metrics, see this list:

Any None results are skipped and not added to the dictionary of results.

Importantly, we provide some verbose output, summarizing the mean and standard deviation of each model after it was evaluated. This is helpful if the spot checking process on your dataset takes minutes to hours.

# evaluate a dict of models {name:object}, returns {name:score}
def evaluate_models(X, y, models, folds=10, metric='accuracy'):
	results = dict()
	for name, model in models.items():
		# evaluate the model
		scores = robust_evaluate_model(X, y, model, folds, metric)
		# show process
		if scores is not None:
			# store a result
			results[name] = scores
			mean_score, std_score = mean(scores), std(scores)
			print('>%s: %.3f (+/-%.3f)' % (name, mean_score, std_score))
		else:
			print('>%s: error' % name)
	return results

Note that if for some reason you want to see warnings and errors, you can update the evaluate_models() to call the evaluate_model() function directly, by-passing the robust error handling. I find this useful when testing out new methods or method configurations that fail silently.

Summarize Results

Finally, we can evaluate the results.

Really, we only want to know what algorithms performed well.

Two useful ways to summarize the results are:

  1. Line summaries of the mean and standard deviation of the top 10 performing algorithms.
  2. Box and whisker plots of the top 10 performing algorithms.

The line summaries are quick and precise, although assume a well behaving Gaussian distribution, which may not be reasonable.

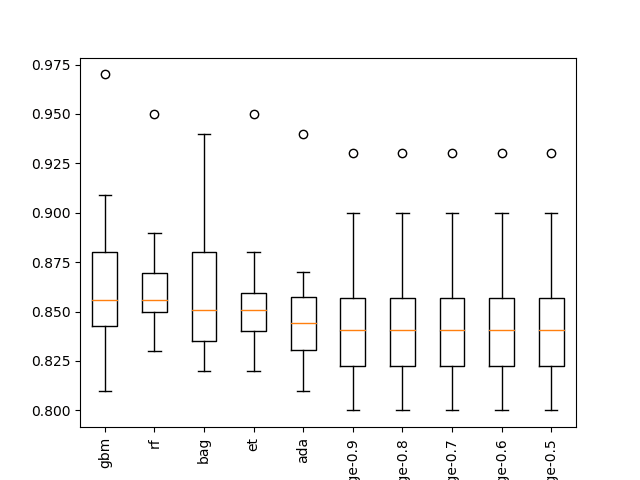
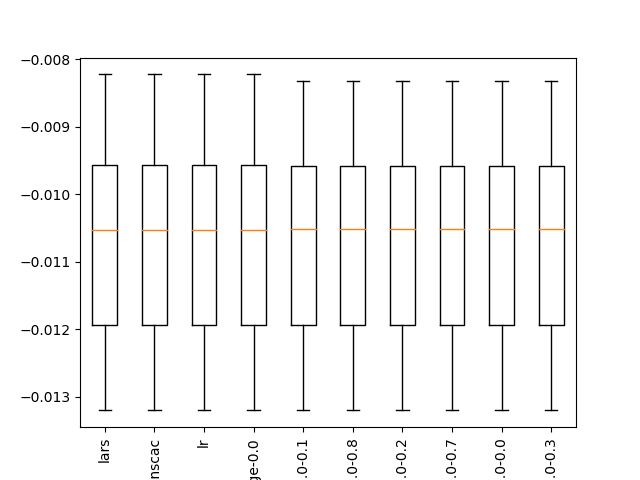
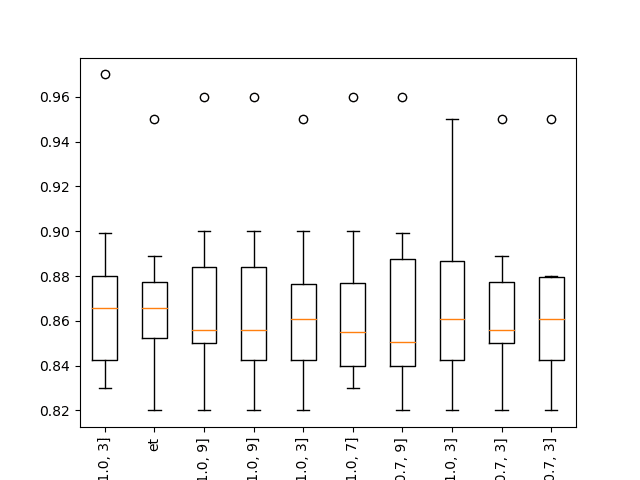
The box and whisker plots assume no distribution and provide a visual way to directly compare the distribution of scores across models in terms of median performance and spread of scores.

We will define a function named summarize_results() that takes the dictionary of results, prints the summary of results, and creates a boxplot image that is saved to file. The function takes an argument to specify if the evaluation score is maximizing, which by default is True. The number of results to summarize can also be provided as an optional parameter, which defaults to 10.

The function first orders the scores before printing the summary and creating the box and whisker plot.

# print and plot the top n results
def summarize_results(results, maximize=True, top_n=10):
	# check for no results
	if len(results) == 0:
		print('no results')
		return
	# determine how many results to summarize
	n = min(top_n, len(results))
	# create a list of (name, mean(scores)) tuples
	mean_scores = [(k,mean(v)) for k,v in results.items()]
	# sort tuples by mean score
	mean_scores = sorted(mean_scores, key=lambda x: x[1])
	# reverse for descending order (e.g. for accuracy)
	if maximize:
		mean_scores = list(reversed(mean_scores))
	# retrieve the top n for summarization
	names = [x[0] for x in mean_scores[:n]]
	scores = [results[x[0]] for x in mean_scores[:n]]
	# print the top n
	print()
	for i in range(n):
		name = names[i]
		mean_score, std_score = mean(results[name]), std(results[name])
		print('Rank=%d, Name=%s, Score=%.3f (+/- %.3f)' % (i+1, name, mean_score, std_score))
	# boxplot for the top n
	pyplot.boxplot(scores, labels=names)
	_, labels = pyplot.xticks()
	pyplot.setp(labels, rotation=90)
	pyplot.savefig('spotcheck.png')

Now that we have specialized a framework for spot-checking algorithms in Python, let’s look at how we can apply it to a classification problem.

3. Spot-Checking for Classification

We will generate a binary classification problem using the make_classification() function.

The function will generate 1,000 samples with 20 variables, with some redundant variables and two classes.

# load the dataset, returns X and y elements
def load_dataset():
	return make_classification(n_samples=1000, n_classes=2, random_state=1)

As a classification problem, we will try a suite of classification algorithms, specifically:

Linear Algorithms

  • Logistic Regression
  • Ridge Regression
  • Stochastic Gradient Descent Classifier
  • Passive Aggressive Classifier

I tried LDA and QDA, but they sadly crashed down in the C-code somewhere.

Nonlinear Algorithms

  • k-Nearest Neighbors
  • Classification and Regression Trees
  • Extra Tree
  • Support Vector Machine
  • Naive Bayes

Ensemble Algorithms

  • AdaBoost
  • Bagged Decision Trees
  • Random Forest
  • Extra Trees
  • Gradient Boosting Machine

Further, I added multiple configurations for a few of the algorithms like Ridge, kNN, and SVM in order to give them a good chance on the problem.

The full define_models() function is listed below.

# create a dict of standard models to evaluate {name:object}
def define_models(models=dict()):
	# linear models
	models['logistic'] = LogisticRegression()
	alpha = [0.1, 0.2, 0.3, 0.4, 0.5, 0.6, 0.7, 0.8, 0.9, 1.0]
	for a in alpha:
		models['ridge-'+str(a)] = RidgeClassifier(alpha=a)
	models['sgd'] = SGDClassifier(max_iter=1000, tol=1e-3)
	models['pa'] = PassiveAggressiveClassifier(max_iter=1000, tol=1e-3)
	# non-linear models
	n_neighbors = range(1, 21)
	for k in n_neighbors:
		models['knn-'+str(k)] = KNeighborsClassifier(n_neighbors=k)
	models['cart'] = DecisionTreeClassifier()
	models['extra'] = ExtraTreeClassifier()
	models['svml'] = SVC(kernel='linear')
	models['svmp'] = SVC(kernel='poly')
	c_values = [0.1, 0.2, 0.3, 0.4, 0.5, 0.6, 0.7, 0.8, 0.9, 1.0]
	for c in c_values:
		models['svmr'+str(c)] = SVC(C=c)
	models['bayes'] = GaussianNB()
	# ensemble models
	n_trees = 100
	models['ada'] = AdaBoostClassifier(n_estimators=n_trees)
	models['bag'] = BaggingClassifier(n_estimators=n_trees)
	models['rf'] = RandomForestClassifier(n_estimators=n_trees)
	models['et'] = ExtraTreesClassifier(n_estimators=n_trees)
	models['gbm'] = GradientBoostingClassifier(n_estimators=n_trees)
	print('Defined %d models' % len(models))
	return models

That’s it; we are now ready to spot check algorithms on the problem.

The complete example is listed below.

# binary classification spot check script
import warnings
from numpy import mean
from numpy import std
from matplotlib import pyplot
from sklearn.datasets import make_classification
from sklearn.model_selection import cross_val_score
from sklearn.preprocessing import StandardScaler
from sklearn.preprocessing import MinMaxScaler
from sklearn.pipeline import Pipeline
from sklearn.linear_model import LogisticRegression
from sklearn.linear_model import RidgeClassifier
from sklearn.linear_model import SGDClassifier
from sklearn.linear_model import PassiveAggressiveClassifier
from sklearn.neighbors import KNeighborsClassifier
from sklearn.tree import DecisionTreeClassifier
from sklearn.tree import ExtraTreeClassifier
from sklearn.svm import SVC
from sklearn.naive_bayes import GaussianNB
from sklearn.ensemble import AdaBoostClassifier
from sklearn.ensemble import BaggingClassifier
from sklearn.ensemble import RandomForestClassifier
from sklearn.ensemble import ExtraTreesClassifier
from sklearn.ensemble import GradientBoostingClassifier

# load the dataset, returns X and y elements
def load_dataset():
	return make_classification(n_samples=1000, n_classes=2, random_state=1)

# create a dict of standard models to evaluate {name:object}
def define_models(models=dict()):
	# linear models
	models['logistic'] = LogisticRegression()
	alpha = [0.1, 0.2, 0.3, 0.4, 0.5, 0.6, 0.7, 0.8, 0.9, 1.0]
	for a in alpha:
		models['ridge-'+str(a)] = RidgeClassifier(alpha=a)
	models['sgd'] = SGDClassifier(max_iter=1000, tol=1e-3)
	models['pa'] = PassiveAggressiveClassifier(max_iter=1000, tol=1e-3)
	# non-linear models
	n_neighbors = range(1, 21)
	for k in n_neighbors:
		models['knn-'+str(k)] = KNeighborsClassifier(n_neighbors=k)
	models['cart'] = DecisionTreeClassifier()
	models['extra'] = ExtraTreeClassifier()
	models['svml'] = SVC(kernel='linear')
	models['svmp'] = SVC(kernel='poly')
	c_values = [0.1, 0.2, 0.3, 0.4, 0.5, 0.6, 0.7, 0.8, 0.9, 1.0]
	for c in c_values:
		models['svmr'+str(c)] = SVC(C=c)
	models['bayes'] = GaussianNB()
	# ensemble models
	n_trees = 100
	models['ada'] = AdaBoostClassifier(n_estimators=n_trees)
	models['bag'] = BaggingClassifier(n_estimators=n_trees)
	models['rf'] = RandomForestClassifier(n_estimators=n_trees)
	models['et'] = ExtraTreesClassifier(n_estimators=n_trees)
	models['gbm'] = GradientBoostingClassifier(n_estimators=n_trees)
	print('Defined %d models' % len(models))
	return models

# create a feature preparation pipeline for a model
def make_pipeline(model):
	steps = list()
	# standardization
	steps.append(('standardize', StandardScaler()))
	# normalization
	steps.append(('normalize', MinMaxScaler()))
	# the model
	steps.append(('model', model))
	# create pipeline
	pipeline = Pipeline(steps=steps)
	return pipeline

# evaluate a single model
def evaluate_model(X, y, model, folds, metric):
	# create the pipeline
	pipeline = make_pipeline(model)
	# evaluate model
	scores = cross_val_score(pipeline, X, y, scoring=metric, cv=folds, n_jobs=-1)
	return scores

# evaluate a model and try to trap errors and and hide warnings
def robust_evaluate_model(X, y, model, folds, metric):
	scores = None
	try:
		with warnings.catch_warnings():
			warnings.filterwarnings("ignore")
			scores = evaluate_model(X, y, model, folds, metric)
	except:
		scores = None
	return scores

# evaluate a dict of models {name:object}, returns {name:score}
def evaluate_models(X, y, models, folds=10, metric='accuracy'):
	results = dict()
	for name, model in models.items():
		# evaluate the model
		scores = robust_evaluate_model(X, y, model, folds, metric)
		# show process
		if scores is not None:
			# store a result
			results[name] = scores
			mean_score, std_score = mean(scores), std(scores)
			print('>%s: %.3f (+/-%.3f)' % (name, mean_score, std_score))
		else:
			print('>%s: error' % name)
	return results

# print and plot the top n results
def summarize_results(results, maximize=True, top_n=10):
	# check for no results
	if len(results) == 0:
		print('no results')
		return
	# determine how many results to summarize
	n = min(top_n, len(results))
	# create a list of (name, mean(scores)) tuples
	mean_scores = [(k,mean(v)) for k,v in results.items()]
	# sort tuples by mean score
	mean_scores = sorted(mean_scores, key=lambda x: x[1])
	# reverse for descending order (e.g. for accuracy)
	if maximize:
		mean_scores = list(reversed(mean_scores))
	# retrieve the top n for summarization
	names = [x[0] for x in mean_scores[:n]]
	scores = [results[x[0]] for x in mean_scores[:n]]
	# print the top n
	print()
	for i in range(n):
		name = names[i]
		mean_score, std_score = mean(results[name]), std(results[name])
		print('Rank=%d, Name=%s, Score=%.3f (+/- %.3f)' % (i+1, name, mean_score, std_score))
	# boxplot for the top n
	pyplot.boxplot(scores, labels=names)
	_, labels = pyplot.xticks()
	pyplot.setp(labels, rotation=90)
	pyplot.savefig('spotcheck.png')

# load dataset
X, y = load_dataset()
# get model list
models = define_models()
# evaluate models
results = evaluate_models(X, y, models)
# summarize results
summarize_results(results)

Running the example prints one line per evaluated model, ending with a summary of the top 10 performing algorithms on the problem.

We can see that ensembles of decision trees performed the best for this problem. This suggests a few things:

  • Ensembles of decision trees might be a good place to focus attention.
  • Gradient boosting will likely do well if further tuned.
  • A “good” performance on the problem is about 86% accuracy.
  • The relatively high performance of ridge regression suggests the need for feature selection.

...
>bag: 0.862 (+/-0.034)
>rf: 0.865 (+/-0.033)
>et: 0.858 (+/-0.035)
>gbm: 0.867 (+/-0.044)

Rank=1, Name=gbm, Score=0.867 (+/- 0.044)
Rank=2, Name=rf, Score=0.865 (+/- 0.033)
Rank=3, Name=bag, Score=0.862 (+/- 0.034)
Rank=4, Name=et, Score=0.858 (+/- 0.035)
Rank=5, Name=ada, Score=0.850 (+/- 0.035)
Rank=6, Name=ridge-0.9, Score=0.848 (+/- 0.038)
Rank=7, Name=ridge-0.8, Score=0.848 (+/- 0.038)
Rank=8, Name=ridge-0.7, Score=0.848 (+/- 0.038)
Rank=9, Name=ridge-0.6, Score=0.848 (+/- 0.038)
Rank=10, Name=ridge-0.5, Score=0.848 (+/- 0.038)

A box and whisker plot is also created to summarize the results of the top 10 well performing algorithms.

The plot shows the elevation of the methods comprised of ensembles of decision trees. The plot enforces the notion that further attention on these methods would be a good idea.

Boxplot of top 10 Spot-Checking Algorithms on a Classification Problem

Boxplot of top 10 Spot-Checking Algorithms on a Classification Problem

If this were a real classification problem, I would follow-up with further spot checks, such as:

  • Spot check with various different feature selection methods.
  • Spot check without data scaling methods.
  • Spot check with a course grid of configurations for gradient boosting in sklearn or XGBoost.

Next, we will see how we can apply the framework to a regression problem.

4. Spot-Checking for Regression

We can explore the same framework for regression predictive modeling problems with only very minor changes.

We can use the make_regression() function to generate a contrived regression problem with 1,000 examples and 50 features, some of them redundant.

The defined load_dataset() function is listed below.

# load the dataset, returns X and y elements
def load_dataset():
	return make_regression(n_samples=1000, n_features=50, noise=0.1, random_state=1)

We can then specify a get_models() function that defines a suite of regression methods.

Scikit-learn does offer a wide range of linear regression methods, which is excellent. Not all of them may be required on your problem. I would recommend a minimum of linear regression and elastic net, the latter with a good suite of alpha and lambda parameters.

Nevertheless, we will test the full suite of methods on this problem, including:

Linear Algorithms

  • Linear Regression
  • Lasso Regression
  • Ridge Regression
  • Elastic Net Regression
  • Huber Regression
  • LARS Regression
  • Lasso LARS Regression
  • Passive Aggressive Regression
  • RANSAC Regressor
  • Stochastic Gradient Descent Regression
  • Theil Regression

Nonlinear Algorithms

  • k-Nearest Neighbors
  • Classification and Regression Tree
  • Extra Tree
  • Support Vector Regression

Ensemble Algorithms

  • AdaBoost
  • Bagged Decision Trees
  • Random Forest
  • Extra Trees
  • Gradient Boosting Machines

The full get_models() function is listed below.

# create a dict of standard models to evaluate {name:object}
def get_models(models=dict()):
	# linear models
	models['lr'] = LinearRegression()
	alpha = [0.0, 0.1, 0.2, 0.3, 0.4, 0.5, 0.6, 0.7, 0.8, 0.9, 1.0]
	for a in alpha:
		models['lasso-'+str(a)] = Lasso(alpha=a)
	for a in alpha:
		models['ridge-'+str(a)] = Ridge(alpha=a)
	for a1 in alpha:
		for a2 in alpha:
			name = 'en-' + str(a1) + '-' + str(a2)
			models[name] = ElasticNet(a1, a2)
	models['huber'] = HuberRegressor()
	models['lars'] = Lars()
	models['llars'] = LassoLars()
	models['pa'] = PassiveAggressiveRegressor(max_iter=1000, tol=1e-3)
	models['ranscac'] = RANSACRegressor()
	models['sgd'] = SGDRegressor(max_iter=1000, tol=1e-3)
	models['theil'] = TheilSenRegressor()
	# non-linear models
	n_neighbors = range(1, 21)
	for k in n_neighbors:
		models['knn-'+str(k)] = KNeighborsRegressor(n_neighbors=k)
	models['cart'] = DecisionTreeRegressor()
	models['extra'] = ExtraTreeRegressor()
	models['svml'] = SVR(kernel='linear')
	models['svmp'] = SVR(kernel='poly')
	c_values = [0.1, 0.2, 0.3, 0.4, 0.5, 0.6, 0.7, 0.8, 0.9, 1.0]
	for c in c_values:
		models['svmr'+str(c)] = SVR(C=c)
	# ensemble models
	n_trees = 100
	models['ada'] = AdaBoostRegressor(n_estimators=n_trees)
	models['bag'] = BaggingRegressor(n_estimators=n_trees)
	models['rf'] = RandomForestRegressor(n_estimators=n_trees)
	models['et'] = ExtraTreesRegressor(n_estimators=n_trees)
	models['gbm'] = GradientBoostingRegressor(n_estimators=n_trees)
	print('Defined %d models' % len(models))
	return models

By default, the framework uses classification accuracy as the method for evaluating model predictions.

This does not make sense for regression, and we can change this something more meaningful for regression, such as mean squared error. We can do this by passing the metric=’neg_mean_squared_error’ argument when calling evaluate_models() function.

# evaluate models
results = evaluate_models(models, metric='neg_mean_squared_error')

Note that by default scikit-learn inverts error scores so that that are maximizing instead of minimizing. This is why the mean squared error is negative and will have a negative sign when summarized. Because the score is inverted, we can continue to assume that we are maximizing scores in the summarize_results() function and do not need to specify maximize=False as we might expect when using an error metric.

The complete code example is listed below.

# regression spot check script
import warnings
from numpy import mean
from numpy import std
from matplotlib import pyplot
from sklearn.datasets import make_regression
from sklearn.model_selection import cross_val_score
from sklearn.preprocessing import StandardScaler
from sklearn.preprocessing import MinMaxScaler
from sklearn.pipeline import Pipeline
from sklearn.linear_model import LinearRegression
from sklearn.linear_model import Lasso
from sklearn.linear_model import Ridge
from sklearn.linear_model import ElasticNet
from sklearn.linear_model import HuberRegressor
from sklearn.linear_model import Lars
from sklearn.linear_model import LassoLars
from sklearn.linear_model import PassiveAggressiveRegressor
from sklearn.linear_model import RANSACRegressor
from sklearn.linear_model import SGDRegressor
from sklearn.linear_model import TheilSenRegressor
from sklearn.neighbors import KNeighborsRegressor
from sklearn.tree import DecisionTreeRegressor
from sklearn.tree import ExtraTreeRegressor
from sklearn.svm import SVR
from sklearn.ensemble import AdaBoostRegressor
from sklearn.ensemble import BaggingRegressor
from sklearn.ensemble import RandomForestRegressor
from sklearn.ensemble import ExtraTreesRegressor
from sklearn.ensemble import GradientBoostingRegressor

# load the dataset, returns X and y elements
def load_dataset():
	return make_regression(n_samples=1000, n_features=50, noise=0.1, random_state=1)

# create a dict of standard models to evaluate {name:object}
def get_models(models=dict()):
	# linear models
	models['lr'] = LinearRegression()
	alpha = [0.0, 0.1, 0.2, 0.3, 0.4, 0.5, 0.6, 0.7, 0.8, 0.9, 1.0]
	for a in alpha:
		models['lasso-'+str(a)] = Lasso(alpha=a)
	for a in alpha:
		models['ridge-'+str(a)] = Ridge(alpha=a)
	for a1 in alpha:
		for a2 in alpha:
			name = 'en-' + str(a1) + '-' + str(a2)
			models[name] = ElasticNet(a1, a2)
	models['huber'] = HuberRegressor()
	models['lars'] = Lars()
	models['llars'] = LassoLars()
	models['pa'] = PassiveAggressiveRegressor(max_iter=1000, tol=1e-3)
	models['ranscac'] = RANSACRegressor()
	models['sgd'] = SGDRegressor(max_iter=1000, tol=1e-3)
	models['theil'] = TheilSenRegressor()
	# non-linear models
	n_neighbors = range(1, 21)
	for k in n_neighbors:
		models['knn-'+str(k)] = KNeighborsRegressor(n_neighbors=k)
	models['cart'] = DecisionTreeRegressor()
	models['extra'] = ExtraTreeRegressor()
	models['svml'] = SVR(kernel='linear')
	models['svmp'] = SVR(kernel='poly')
	c_values = [0.1, 0.2, 0.3, 0.4, 0.5, 0.6, 0.7, 0.8, 0.9, 1.0]
	for c in c_values:
		models['svmr'+str(c)] = SVR(C=c)
	# ensemble models
	n_trees = 100
	models['ada'] = AdaBoostRegressor(n_estimators=n_trees)
	models['bag'] = BaggingRegressor(n_estimators=n_trees)
	models['rf'] = RandomForestRegressor(n_estimators=n_trees)
	models['et'] = ExtraTreesRegressor(n_estimators=n_trees)
	models['gbm'] = GradientBoostingRegressor(n_estimators=n_trees)
	print('Defined %d models' % len(models))
	return models

# create a feature preparation pipeline for a model
def make_pipeline(model):
	steps = list()
	# standardization
	steps.append(('standardize', StandardScaler()))
	# normalization
	steps.append(('normalize', MinMaxScaler()))
	# the model
	steps.append(('model', model))
	# create pipeline
	pipeline = Pipeline(steps=steps)
	return pipeline

# evaluate a single model
def evaluate_model(X, y, model, folds, metric):
	# create the pipeline
	pipeline = make_pipeline(model)
	# evaluate model
	scores = cross_val_score(pipeline, X, y, scoring=metric, cv=folds, n_jobs=-1)
	return scores

# evaluate a model and try to trap errors and and hide warnings
def robust_evaluate_model(X, y, model, folds, metric):
	scores = None
	try:
		with warnings.catch_warnings():
			warnings.filterwarnings("ignore")
			scores = evaluate_model(X, y, model, folds, metric)
	except:
		scores = None
	return scores

# evaluate a dict of models {name:object}, returns {name:score}
def evaluate_models(X, y, models, folds=10, metric='accuracy'):
	results = dict()
	for name, model in models.items():
		# evaluate the model
		scores = robust_evaluate_model(X, y, model, folds, metric)
		# show process
		if scores is not None:
			# store a result
			results[name] = scores
			mean_score, std_score = mean(scores), std(scores)
			print('>%s: %.3f (+/-%.3f)' % (name, mean_score, std_score))
		else:
			print('>%s: error' % name)
	return results

# print and plot the top n results
def summarize_results(results, maximize=True, top_n=10):
	# check for no results
	if len(results) == 0:
		print('no results')
		return
	# determine how many results to summarize
	n = min(top_n, len(results))
	# create a list of (name, mean(scores)) tuples
	mean_scores = [(k,mean(v)) for k,v in results.items()]
	# sort tuples by mean score
	mean_scores = sorted(mean_scores, key=lambda x: x[1])
	# reverse for descending order (e.g. for accuracy)
	if maximize:
		mean_scores = list(reversed(mean_scores))
	# retrieve the top n for summarization
	names = [x[0] for x in mean_scores[:n]]
	scores = [results[x[0]] for x in mean_scores[:n]]
	# print the top n
	print()
	for i in range(n):
		name = names[i]
		mean_score, std_score = mean(results[name]), std(results[name])
		print('Rank=%d, Name=%s, Score=%.3f (+/- %.3f)' % (i+1, name, mean_score, std_score))
	# boxplot for the top n
	pyplot.boxplot(scores, labels=names)
	_, labels = pyplot.xticks()
	pyplot.setp(labels, rotation=90)
	pyplot.savefig('spotcheck.png')

# load dataset
X, y = load_dataset()
# get model list
models = get_models()
# evaluate models
results = evaluate_models(X, y, models, metric='neg_mean_squared_error')
# summarize results
summarize_results(results)

Running the example summarizes the performance of each model evaluated, then prints the performance of the top 10 well performing algorithms.

We can see that many of the linear algorithms perhaps found the same optimal solution on this problem. Notably those methods that performed well use regularization as a type of feature selection, allowing them to zoom in on the optimal solution.

This would suggest the importance of feature selection when modeling this problem and that linear methods would be the area to focus, at least for now.

Reviewing the printed scores of evaluated models also shows how poorly nonlinear and ensemble algorithms performed on this problem.

...
>bag: -6118.084 (+/-1558.433)
>rf: -6127.169 (+/-1594.392)
>et: -5017.062 (+/-1037.673)
>gbm: -2347.807 (+/-500.364)

Rank=1, Name=lars, Score=-0.011 (+/- 0.001)
Rank=2, Name=ranscac, Score=-0.011 (+/- 0.001)
Rank=3, Name=lr, Score=-0.011 (+/- 0.001)
Rank=4, Name=ridge-0.0, Score=-0.011 (+/- 0.001)
Rank=5, Name=en-0.0-0.1, Score=-0.011 (+/- 0.001)
Rank=6, Name=en-0.0-0.8, Score=-0.011 (+/- 0.001)
Rank=7, Name=en-0.0-0.2, Score=-0.011 (+/- 0.001)
Rank=8, Name=en-0.0-0.7, Score=-0.011 (+/- 0.001)
Rank=9, Name=en-0.0-0.0, Score=-0.011 (+/- 0.001)
Rank=10, Name=en-0.0-0.3, Score=-0.011 (+/- 0.001)

A box and whisker plot is created, not really adding value to the analysis of results in this case.

Boxplot of top 10 Spot-Checking Algorithms on a Regression Problem

Boxplot of top 10 Spot-Checking Algorithms on a Regression Problem

5. Framework Extension

In this section, we explore some handy extensions of the spot check framework.

Course Grid Search for Gradient Boosting

I find myself using XGBoost and gradient boosting a lot for straight-forward classification and regression problems.

As such, I like to use a course grid across standard configuration parameters of the method when spot checking.

Below is a function to do this that can be used directly in the spot checking framework.

# define gradient boosting models
def define_gbm_models(models=dict(), use_xgb=True):
	# define config ranges
	rates = [0.001, 0.01, 0.1]
	trees = [50, 100]
	ss = [0.5, 0.7, 1.0]
	depth = [3, 7, 9]
	# add configurations
	for l in rates:
		for e in trees:
			for s in ss:
				for d in depth:
					cfg = [l, e, s, d]
					if use_xgb:
						name = 'xgb-' + str(cfg)
						models[name] = XGBClassifier(learning_rate=l, n_estimators=e, subsample=s, max_depth=d)
					else:
						name = 'gbm-' + str(cfg)
						models[name] = GradientBoostingClassifier(learning_rate=l, n_estimators=e, subsample=s, max_depth=d)
	print('Defined %d models' % len(models))
	return models

By default, the function will use XGBoost models, but can use the sklearn gradient boosting model if the use_xgb argument to the function is set to False.

Again, we are not trying to optimally tune GBM on the problem, only very quickly find an area in the configuration space that may be worth investigating further.

This function can be used directly on classification and regression problems with only a minor change from “XGBClassifier” to “XGBRegressor” and “GradientBoostingClassifier” to “GradientBoostingRegressor“. For example:

# define gradient boosting models
def get_gbm_models(models=dict(), use_xgb=True):
	# define config ranges
	rates = [0.001, 0.01, 0.1]
	trees = [50, 100]
	ss = [0.5, 0.7, 1.0]
	depth = [3, 7, 9]
	# add configurations
	for l in rates:
		for e in trees:
			for s in ss:
				for d in depth:
					cfg = [l, e, s, d]
					if use_xgb:
						name = 'xgb-' + str(cfg)
						models[name] = XGBRegressor(learning_rate=l, n_estimators=e, subsample=s, max_depth=d)
					else:
						name = 'gbm-' + str(cfg)
						models[name] = GradientBoostingXGBRegressor(learning_rate=l, n_estimators=e, subsample=s, max_depth=d)
	print('Defined %d models' % len(models))
	return models

To make this concrete, below is the binary classification example updated to also define XGBoost models.

# binary classification spot check script
import warnings
from numpy import mean
from numpy import std
from matplotlib import pyplot
from sklearn.datasets import make_classification
from sklearn.model_selection import cross_val_score
from sklearn.preprocessing import StandardScaler
from sklearn.preprocessing import MinMaxScaler
from sklearn.pipeline import Pipeline
from sklearn.linear_model import LogisticRegression
from sklearn.linear_model import RidgeClassifier
from sklearn.linear_model import SGDClassifier
from sklearn.linear_model import PassiveAggressiveClassifier
from sklearn.neighbors import KNeighborsClassifier
from sklearn.tree import DecisionTreeClassifier
from sklearn.tree import ExtraTreeClassifier
from sklearn.svm import SVC
from sklearn.naive_bayes import GaussianNB
from sklearn.ensemble import AdaBoostClassifier
from sklearn.ensemble import BaggingClassifier
from sklearn.ensemble import RandomForestClassifier
from sklearn.ensemble import ExtraTreesClassifier
from sklearn.ensemble import GradientBoostingClassifier
from xgboost import XGBClassifier

# load the dataset, returns X and y elements
def load_dataset():
	return make_classification(n_samples=1000, n_classes=2, random_state=1)

# create a dict of standard models to evaluate {name:object}
def define_models(models=dict()):
	# linear models
	models['logistic'] = LogisticRegression()
	alpha = [0.1, 0.2, 0.3, 0.4, 0.5, 0.6, 0.7, 0.8, 0.9, 1.0]
	for a in alpha:
		models['ridge-'+str(a)] = RidgeClassifier(alpha=a)
	models['sgd'] = SGDClassifier(max_iter=1000, tol=1e-3)
	models['pa'] = PassiveAggressiveClassifier(max_iter=1000, tol=1e-3)
	# non-linear models
	n_neighbors = range(1, 21)
	for k in n_neighbors:
		models['knn-'+str(k)] = KNeighborsClassifier(n_neighbors=k)
	models['cart'] = DecisionTreeClassifier()
	models['extra'] = ExtraTreeClassifier()
	models['svml'] = SVC(kernel='linear')
	models['svmp'] = SVC(kernel='poly')
	c_values = [0.1, 0.2, 0.3, 0.4, 0.5, 0.6, 0.7, 0.8, 0.9, 1.0]
	for c in c_values:
		models['svmr'+str(c)] = SVC(C=c)
	models['bayes'] = GaussianNB()
	# ensemble models
	n_trees = 100
	models['ada'] = AdaBoostClassifier(n_estimators=n_trees)
	models['bag'] = BaggingClassifier(n_estimators=n_trees)
	models['rf'] = RandomForestClassifier(n_estimators=n_trees)
	models['et'] = ExtraTreesClassifier(n_estimators=n_trees)
	models['gbm'] = GradientBoostingClassifier(n_estimators=n_trees)
	print('Defined %d models' % len(models))
	return models

# define gradient boosting models
def define_gbm_models(models=dict(), use_xgb=True):
	# define config ranges
	rates = [0.001, 0.01, 0.1]
	trees = [50, 100]
	ss = [0.5, 0.7, 1.0]
	depth = [3, 7, 9]
	# add configurations
	for l in rates:
		for e in trees:
			for s in ss:
				for d in depth:
					cfg = [l, e, s, d]
					if use_xgb:
						name = 'xgb-' + str(cfg)
						models[name] = XGBClassifier(learning_rate=l, n_estimators=e, subsample=s, max_depth=d)
					else:
						name = 'gbm-' + str(cfg)
						models[name] = GradientBoostingClassifier(learning_rate=l, n_estimators=e, subsample=s, max_depth=d)
	print('Defined %d models' % len(models))
	return models

# create a feature preparation pipeline for a model
def make_pipeline(model):
	steps = list()
	# standardization
	steps.append(('standardize', StandardScaler()))
	# normalization
	steps.append(('normalize', MinMaxScaler()))
	# the model
	steps.append(('model', model))
	# create pipeline
	pipeline = Pipeline(steps=steps)
	return pipeline

# evaluate a single model
def evaluate_model(X, y, model, folds, metric):
	# create the pipeline
	pipeline = make_pipeline(model)
	# evaluate model
	scores = cross_val_score(pipeline, X, y, scoring=metric, cv=folds, n_jobs=-1)
	return scores

# evaluate a model and try to trap errors and and hide warnings
def robust_evaluate_model(X, y, model, folds, metric):
	scores = None
	try:
		with warnings.catch_warnings():
			warnings.filterwarnings("ignore")
			scores = evaluate_model(X, y, model, folds, metric)
	except:
		scores = None
	return scores

# evaluate a dict of models {name:object}, returns {name:score}
def evaluate_models(X, y, models, folds=10, metric='accuracy'):
	results = dict()
	for name, model in models.items():
		# evaluate the model
		scores = robust_evaluate_model(X, y, model, folds, metric)
		# show process
		if scores is not None:
			# store a result
			results[name] = scores
			mean_score, std_score = mean(scores), std(scores)
			print('>%s: %.3f (+/-%.3f)' % (name, mean_score, std_score))
		else:
			print('>%s: error' % name)
	return results

# print and plot the top n results
def summarize_results(results, maximize=True, top_n=10):
	# check for no results
	if len(results) == 0:
		print('no results')
		return
	# determine how many results to summarize
	n = min(top_n, len(results))
	# create a list of (name, mean(scores)) tuples
	mean_scores = [(k,mean(v)) for k,v in results.items()]
	# sort tuples by mean score
	mean_scores = sorted(mean_scores, key=lambda x: x[1])
	# reverse for descending order (e.g. for accuracy)
	if maximize:
		mean_scores = list(reversed(mean_scores))
	# retrieve the top n for summarization
	names = [x[0] for x in mean_scores[:n]]
	scores = [results[x[0]] for x in mean_scores[:n]]
	# print the top n
	print()
	for i in range(n):
		name = names[i]
		mean_score, std_score = mean(results[name]), std(results[name])
		print('Rank=%d, Name=%s, Score=%.3f (+/- %.3f)' % (i+1, name, mean_score, std_score))
	# boxplot for the top n
	pyplot.boxplot(scores, labels=names)
	_, labels = pyplot.xticks()
	pyplot.setp(labels, rotation=90)
	pyplot.savefig('spotcheck.png')

# load dataset
X, y = load_dataset()
# get model list
models = define_models()
# add gbm models
models = define_gbm_models(models)
# evaluate models
results = evaluate_models(X, y, models)
# summarize results
summarize_results(results)

Running the example shows that indeed some XGBoost models perform well on the problem.

...
>xgb-[0.1, 100, 1.0, 3]: 0.864 (+/-0.044)
>xgb-[0.1, 100, 1.0, 7]: 0.865 (+/-0.036)
>xgb-[0.1, 100, 1.0, 9]: 0.867 (+/-0.039)

Rank=1, Name=xgb-[0.1, 50, 1.0, 3], Score=0.872 (+/- 0.039)
Rank=2, Name=et, Score=0.869 (+/- 0.033)
Rank=3, Name=xgb-[0.1, 50, 1.0, 9], Score=0.868 (+/- 0.038)
Rank=4, Name=xgb-[0.1, 100, 1.0, 9], Score=0.867 (+/- 0.039)
Rank=5, Name=xgb-[0.01, 50, 1.0, 3], Score=0.867 (+/- 0.035)
Rank=6, Name=xgb-[0.1, 50, 1.0, 7], Score=0.867 (+/- 0.037)
Rank=7, Name=xgb-[0.001, 100, 0.7, 9], Score=0.866 (+/- 0.040)
Rank=8, Name=xgb-[0.01, 100, 1.0, 3], Score=0.866 (+/- 0.037)
Rank=9, Name=xgb-[0.001, 100, 0.7, 3], Score=0.866 (+/- 0.034)
Rank=10, Name=xgb-[0.01, 50, 0.7, 3], Score=0.866 (+/- 0.034)

Boxplot of top 10 Spot-Checking Algorithms on a Classification Problem with XGBoost

Boxplot of top 10 Spot-Checking Algorithms on a Classification Problem with XGBoost

Repeated Evaluations

The above results also highlight the noisy nature of the evaluations, e.g. the results of extra trees in this run are different from the run above (0.858 vs 0.869).

We are using k-fold cross-validation to produce a population of scores, but the population is small and the calculated mean will be noisy.

This is fine as long as we take the spot-check results as a starting point and not definitive results of an algorithm on the problem. This is hard to do; it takes discipline in the practitioner.

Alternately, you may want to adapt the framework such that the model evaluation scheme better matches the model evaluation scheme you intend to use for your specific problem.

For example, when evaluating stochastic algorithms like bagged or boosted decision trees, it is a good idea to run each experiment multiple times on the same train/test sets (called repeats) in order to account for the stochastic nature of the learning algorithm.

We can update the evaluate_model() function to repeat the evaluation of a given model n-times, with a different split of the data each time, then return all scores. For example, three repeats of 10-fold cross-validation will result in 30 scores from each to calculate a mean performance of a model.

# evaluate a single model
def evaluate_model(X, y, model, folds, repeats, metric):
	# create the pipeline
	pipeline = make_pipeline(model)
	# evaluate model
	scores = list()
	# repeat model evaluation n times
	for _ in range(repeats):
		# perform run
		scores_r = cross_val_score(pipeline, X, y, scoring=metric, cv=folds, n_jobs=-1)
		# add scores to list
		scores += scores_r.tolist()
	return scores

Alternately, you may prefer to calculate a mean score from each k-fold cross-validation run, then calculate a grand mean of all runs, as described in:

We can then update the robust_evaluate_model() function to pass down the repeats argument and the evaluate_models() function to define a default, such as 3.

A complete example of the binary classification example with three repeats of model evaluation is listed below.

# binary classification spot check script
import warnings
from numpy import mean
from numpy import std
from matplotlib import pyplot
from sklearn.datasets import make_classification
from sklearn.model_selection import cross_val_score
from sklearn.preprocessing import StandardScaler
from sklearn.preprocessing import MinMaxScaler
from sklearn.pipeline import Pipeline
from sklearn.linear_model import LogisticRegression
from sklearn.linear_model import RidgeClassifier
from sklearn.linear_model import SGDClassifier
from sklearn.linear_model import PassiveAggressiveClassifier
from sklearn.neighbors import KNeighborsClassifier
from sklearn.tree import DecisionTreeClassifier
from sklearn.tree import ExtraTreeClassifier
from sklearn.svm import SVC
from sklearn.naive_bayes import GaussianNB
from sklearn.ensemble import AdaBoostClassifier
from sklearn.ensemble import BaggingClassifier
from sklearn.ensemble import RandomForestClassifier
from sklearn.ensemble import ExtraTreesClassifier
from sklearn.ensemble import GradientBoostingClassifier

# load the dataset, returns X and y elements
def load_dataset():
	return make_classification(n_samples=1000, n_classes=2, random_state=1)

# create a dict of standard models to evaluate {name:object}
def define_models(models=dict()):
	# linear models
	models['logistic'] = LogisticRegression()
	alpha = [0.1, 0.2, 0.3, 0.4, 0.5, 0.6, 0.7, 0.8, 0.9, 1.0]
	for a in alpha:
		models['ridge-'+str(a)] = RidgeClassifier(alpha=a)
	models['sgd'] = SGDClassifier(max_iter=1000, tol=1e-3)
	models['pa'] = PassiveAggressiveClassifier(max_iter=1000, tol=1e-3)
	# non-linear models
	n_neighbors = range(1, 21)
	for k in n_neighbors:
		models['knn-'+str(k)] = KNeighborsClassifier(n_neighbors=k)
	models['cart'] = DecisionTreeClassifier()
	models['extra'] = ExtraTreeClassifier()
	models['svml'] = SVC(kernel='linear')
	models['svmp'] = SVC(kernel='poly')
	c_values = [0.1, 0.2, 0.3, 0.4, 0.5, 0.6, 0.7, 0.8, 0.9, 1.0]
	for c in c_values:
		models['svmr'+str(c)] = SVC(C=c)
	models['bayes'] = GaussianNB()
	# ensemble models
	n_trees = 100
	models['ada'] = AdaBoostClassifier(n_estimators=n_trees)
	models['bag'] = BaggingClassifier(n_estimators=n_trees)
	models['rf'] = RandomForestClassifier(n_estimators=n_trees)
	models['et'] = ExtraTreesClassifier(n_estimators=n_trees)
	models['gbm'] = GradientBoostingClassifier(n_estimators=n_trees)
	print('Defined %d models' % len(models))
	return models

# create a feature preparation pipeline for a model
def make_pipeline(model):
	steps = list()
	# standardization
	steps.append(('standardize', StandardScaler()))
	# normalization
	steps.append(('normalize', MinMaxScaler()))
	# the model
	steps.append(('model', model))
	# create pipeline
	pipeline = Pipeline(steps=steps)
	return pipeline

# evaluate a single model
def evaluate_model(X, y, model, folds, repeats, metric):
	# create the pipeline
	pipeline = make_pipeline(model)
	# evaluate model
	scores = list()
	# repeat model evaluation n times
	for _ in range(repeats):
		# perform run
		scores_r = cross_val_score(pipeline, X, y, scoring=metric, cv=folds, n_jobs=-1)
		# add scores to list
		scores += scores_r.tolist()
	return scores

# evaluate a model and try to trap errors and hide warnings
def robust_evaluate_model(X, y, model, folds, repeats, metric):
	scores = None
	try:
		with warnings.catch_warnings():
			warnings.filterwarnings("ignore")
			scores = evaluate_model(X, y, model, folds, repeats, metric)
	except:
		scores = None
	return scores

# evaluate a dict of models {name:object}, returns {name:score}
def evaluate_models(X, y, models, folds=10, repeats=3, metric='accuracy'):
	results = dict()
	for name, model in models.items():
		# evaluate the model
		scores = robust_evaluate_model(X, y, model, folds, repeats, metric)
		# show process
		if scores is not None:
			# store a result
			results[name] = scores
			mean_score, std_score = mean(scores), std(scores)
			print('>%s: %.3f (+/-%.3f)' % (name, mean_score, std_score))
		else:
			print('>%s: error' % name)
	return results

# print and plot the top n results
def summarize_results(results, maximize=True, top_n=10):
	# check for no results
	if len(results) == 0:
		print('no results')
		return
	# determine how many results to summarize
	n = min(top_n, len(results))
	# create a list of (name, mean(scores)) tuples
	mean_scores = [(k,mean(v)) for k,v in results.items()]
	# sort tuples by mean score
	mean_scores = sorted(mean_scores, key=lambda x: x[1])
	# reverse for descending order (e.g. for accuracy)
	if maximize:
		mean_scores = list(reversed(mean_scores))
	# retrieve the top n for summarization
	names = [x[0] for x in mean_scores[:n]]
	scores = [results[x[0]] for x in mean_scores[:n]]
	# print the top n
	print()
	for i in range(n):
		name = names[i]
		mean_score, std_score = mean(results[name]), std(results[name])
		print('Rank=%d, Name=%s, Score=%.3f (+/- %.3f)' % (i+1, name, mean_score, std_score))
	# boxplot for the top n
	pyplot.boxplot(scores, labels=names)
	_, labels = pyplot.xticks()
	pyplot.setp(labels, rotation=90)
	pyplot.savefig('spotcheck.png')

# load dataset
X, y = load_dataset()
# get model list
models = define_models()
# evaluate models
results = evaluate_models(X, y, models)
# summarize results
summarize_results(results)

Running the example produces a more robust estimate of the scores.

...
>bag: 0.861 (+/-0.037)
>rf: 0.859 (+/-0.036)
>et: 0.869 (+/-0.035)
>gbm: 0.867 (+/-0.044)

Rank=1, Name=et, Score=0.869 (+/- 0.035)
Rank=2, Name=gbm, Score=0.867 (+/- 0.044)
Rank=3, Name=bag, Score=0.861 (+/- 0.037)
Rank=4, Name=rf, Score=0.859 (+/- 0.036)
Rank=5, Name=ada, Score=0.850 (+/- 0.035)
Rank=6, Name=ridge-0.9, Score=0.848 (+/- 0.038)
Rank=7, Name=ridge-0.8, Score=0.848 (+/- 0.038)
Rank=8, Name=ridge-0.7, Score=0.848 (+/- 0.038)
Rank=9, Name=ridge-0.6, Score=0.848 (+/- 0.038)
Rank=10, Name=ridge-0.5, Score=0.848 (+/- 0.038)

There will still be some variance in the reported means, but less than a single run of k-fold cross-validation.

The number of repeats may be increased to further reduce this variance, at the cost of longer run times, and perhaps against the intent of spot checking.

Varied Input Representations

I am a big fan of avoiding assumptions and recommendations for data representations prior to fitting models.

Instead, I like to also spot-check multiple representations and transforms of input data, which I refer to as views. I explain this more in the post:

We can update the framework to spot-check multiple different representations for each model.

One way to do this is to update the evaluate_models() function so that we can provide a list of make_pipeline() functions that can be used for each defined model.

# evaluate a dict of models {name:object}, returns {name:score}
def evaluate_models(X, y, models, pipe_funcs, folds=10, metric='accuracy'):
	results = dict()
	for name, model in models.items():
		# evaluate model under each preparation function
		for i in range(len(pipe_funcs)):
			# evaluate the model
			scores = robust_evaluate_model(X, y, model, folds, metric, pipe_funcs[i])
			# update name
			run_name = str(i) + name
			# show process
			if scores is not None:
				# store a result
				results[run_name] = scores
				mean_score, std_score = mean(scores), std(scores)
				print('>%s: %.3f (+/-%.3f)' % (run_name, mean_score, std_score))
			else:
				print('>%s: error' % run_name)
	return results

The chosen pipeline function can then be passed along down to the robust_evaluate_model() function and to the evaluate_model() function where it can be used.

We can then define a bunch of different pipeline functions; for example:

# no transforms pipeline
def pipeline_none(model):
	return model

# standardize transform pipeline
def pipeline_standardize(model):
	steps = list()
	# standardization
	steps.append(('standardize', StandardScaler()))
	# the model
	steps.append(('model', model))
	# create pipeline
	pipeline = Pipeline(steps=steps)
	return pipeline

# normalize transform pipeline
def pipeline_normalize(model):
	steps = list()
	# normalization
	steps.append(('normalize', MinMaxScaler()))
	# the model
	steps.append(('model', model))
	# create pipeline
	pipeline = Pipeline(steps=steps)
	return pipeline

# standardize and normalize pipeline
def pipeline_std_norm(model):
	steps = list()
	# standardization
	steps.append(('standardize', StandardScaler()))
	# normalization
	steps.append(('normalize', MinMaxScaler()))
	# the model
	steps.append(('model', model))
	# create pipeline
	pipeline = Pipeline(steps=steps)
	return pipeline

Then create a list of these function names that can be provided to the evaluate_models() function.

# define transform pipelines
pipelines = [pipeline_none, pipeline_standardize, pipeline_normalize, pipeline_std_norm]

The complete example of the classification case updated to spot check pipeline transforms is listed below.

# binary classification spot check script
import warnings
from numpy import mean
from numpy import std
from matplotlib import pyplot
from sklearn.datasets import make_classification
from sklearn.model_selection import cross_val_score
from sklearn.preprocessing import StandardScaler
from sklearn.preprocessing import MinMaxScaler
from sklearn.pipeline import Pipeline
from sklearn.linear_model import LogisticRegression
from sklearn.linear_model import RidgeClassifier
from sklearn.linear_model import SGDClassifier
from sklearn.linear_model import PassiveAggressiveClassifier
from sklearn.neighbors import KNeighborsClassifier
from sklearn.tree import DecisionTreeClassifier
from sklearn.tree import ExtraTreeClassifier
from sklearn.svm import SVC
from sklearn.naive_bayes import GaussianNB
from sklearn.ensemble import AdaBoostClassifier
from sklearn.ensemble import BaggingClassifier
from sklearn.ensemble import RandomForestClassifier
from sklearn.ensemble import ExtraTreesClassifier
from sklearn.ensemble import GradientBoostingClassifier

# load the dataset, returns X and y elements
def load_dataset():
	return make_classification(n_samples=1000, n_classes=2, random_state=1)

# create a dict of standard models to evaluate {name:object}
def define_models(models=dict()):
	# linear models
	models['logistic'] = LogisticRegression()
	alpha = [0.1, 0.2, 0.3, 0.4, 0.5, 0.6, 0.7, 0.8, 0.9, 1.0]
	for a in alpha:
		models['ridge-'+str(a)] = RidgeClassifier(alpha=a)
	models['sgd'] = SGDClassifier(max_iter=1000, tol=1e-3)
	models['pa'] = PassiveAggressiveClassifier(max_iter=1000, tol=1e-3)
	# non-linear models
	n_neighbors = range(1, 21)
	for k in n_neighbors:
		models['knn-'+str(k)] = KNeighborsClassifier(n_neighbors=k)
	models['cart'] = DecisionTreeClassifier()
	models['extra'] = ExtraTreeClassifier()
	models['svml'] = SVC(kernel='linear')
	models['svmp'] = SVC(kernel='poly')
	c_values = [0.1, 0.2, 0.3, 0.4, 0.5, 0.6, 0.7, 0.8, 0.9, 1.0]
	for c in c_values:
		models['svmr'+str(c)] = SVC(C=c)
	models['bayes'] = GaussianNB()
	# ensemble models
	n_trees = 100
	models['ada'] = AdaBoostClassifier(n_estimators=n_trees)
	models['bag'] = BaggingClassifier(n_estimators=n_trees)
	models['rf'] = RandomForestClassifier(n_estimators=n_trees)
	models['et'] = ExtraTreesClassifier(n_estimators=n_trees)
	models['gbm'] = GradientBoostingClassifier(n_estimators=n_trees)
	print('Defined %d models' % len(models))
	return models

# no transforms pipeline
def pipeline_none(model):
	return model

# standardize transform pipeline
def pipeline_standardize(model):
	steps = list()
	# standardization
	steps.append(('standardize', StandardScaler()))
	# the model
	steps.append(('model', model))
	# create pipeline
	pipeline = Pipeline(steps=steps)
	return pipeline

# normalize transform pipeline
def pipeline_normalize(model):
	steps = list()
	# normalization
	steps.append(('normalize', MinMaxScaler()))
	# the model
	steps.append(('model', model))
	# create pipeline
	pipeline = Pipeline(steps=steps)
	return pipeline

# standardize and normalize pipeline
def pipeline_std_norm(model):
	steps = list()
	# standardization
	steps.append(('standardize', StandardScaler()))
	# normalization
	steps.append(('normalize', MinMaxScaler()))
	# the model
	steps.append(('model', model))
	# create pipeline
	pipeline = Pipeline(steps=steps)
	return pipeline

# evaluate a single model
def evaluate_model(X, y, model, folds, metric, pipe_func):
	# create the pipeline
	pipeline = pipe_func(model)
	# evaluate model
	scores = cross_val_score(pipeline, X, y, scoring=metric, cv=folds, n_jobs=-1)
	return scores

# evaluate a model and try to trap errors and and hide warnings
def robust_evaluate_model(X, y, model, folds, metric, pipe_func):
	scores = None
	try:
		with warnings.catch_warnings():
			warnings.filterwarnings("ignore")
			scores = evaluate_model(X, y, model, folds, metric, pipe_func)
	except:
		scores = None
	return scores

# evaluate a dict of models {name:object}, returns {name:score}
def evaluate_models(X, y, models, pipe_funcs, folds=10, metric='accuracy'):
	results = dict()
	for name, model in models.items():
		# evaluate model under each preparation function
		for i in range(len(pipe_funcs)):
			# evaluate the model
			scores = robust_evaluate_model(X, y, model, folds, metric, pipe_funcs[i])
			# update name
			run_name = str(i) + name
			# show process
			if scores is not None:
				# store a result
				results[run_name] = scores
				mean_score, std_score = mean(scores), std(scores)
				print('>%s: %.3f (+/-%.3f)' % (run_name, mean_score, std_score))
			else:
				print('>%s: error' % run_name)
	return results

# print and plot the top n results
def summarize_results(results, maximize=True, top_n=10):
	# check for no results
	if len(results) == 0:
		print('no results')
		return
	# determine how many results to summarize
	n = min(top_n, len(results))
	# create a list of (name, mean(scores)) tuples
	mean_scores = [(k,mean(v)) for k,v in results.items()]
	# sort tuples by mean score
	mean_scores = sorted(mean_scores, key=lambda x: x[1])
	# reverse for descending order (e.g. for accuracy)
	if maximize:
		mean_scores = list(reversed(mean_scores))
	# retrieve the top n for summarization
	names = [x[0] for x in mean_scores[:n]]
	scores = [results[x[0]] for x in mean_scores[:n]]
	# print the top n
	print()
	for i in range(n):
		name = names[i]
		mean_score, std_score = mean(results[name]), std(results[name])
		print('Rank=%d, Name=%s, Score=%.3f (+/- %.3f)' % (i+1, name, mean_score, std_score))
	# boxplot for the top n
	pyplot.boxplot(scores, labels=names)
	_, labels = pyplot.xticks()
	pyplot.setp(labels, rotation=90)
	pyplot.savefig('spotcheck.png')

# load dataset
X, y = load_dataset()
# get model list
models = define_models()
# define transform pipelines
pipelines = [pipeline_none, pipeline_standardize, pipeline_normalize, pipeline_std_norm]
# evaluate models
results = evaluate_models(X, y, models, pipelines)
# summarize results
summarize_results(results)

Running the example shows that we differentiate the results for each pipeline by adding the pipeline number to the beginning of the algorithm description name, e.g. ‘0rf‘ means RF with the first pipeline, which is no transforms.

The ensembles of trees algorithms perform well on this problem, and these algorithms are invariant to data scaling. This means that their results on each pipeline will be similar (or the same) and in turn they will crowd out other algorithms in the top-10 list.

...
>0gbm: 0.865 (+/-0.044)
>1gbm: 0.865 (+/-0.044)
>2gbm: 0.865 (+/-0.044)
>3gbm: 0.865 (+/-0.044)

Rank=1, Name=3rf, Score=0.870 (+/- 0.034)
Rank=2, Name=2rf, Score=0.870 (+/- 0.034)
Rank=3, Name=1rf, Score=0.870 (+/- 0.034)
Rank=4, Name=0rf, Score=0.870 (+/- 0.034)
Rank=5, Name=3bag, Score=0.866 (+/- 0.039)
Rank=6, Name=2bag, Score=0.866 (+/- 0.039)
Rank=7, Name=1bag, Score=0.866 (+/- 0.039)
Rank=8, Name=0bag, Score=0.866 (+/- 0.039)
Rank=9, Name=3gbm, Score=0.865 (+/- 0.044)
Rank=10, Name=2gbm, Score=0.865 (+/- 0.044)

Further Reading

This section provides more resources on the topic if you are looking to go deeper.

Summary

In this tutorial, you discovered the usefulness of spot-checking algorithms on a new predictive modeling problem and how to develop a standard framework for spot-checking algorithms in python for classification and regression problems.

Specifically, you learned:

  • Spot-checking provides a way to quickly discover the types of algorithms that perform well on your predictive modeling problem.
  • How to develop a generic framework for loading data, defining models, evaluating models, and summarizing results.
  • How to apply the framework for classification and regression problems.

Have you used this framework or do you have some further suggestions to improve it?
Let me know in the comments.

Do you have any questions?
Ask your questions in the comments below and I will do my best to answer.

The post How to Develop a Reusable Framework to Spot-Check Algorithms in Python appeared first on Machine Learning Mastery.

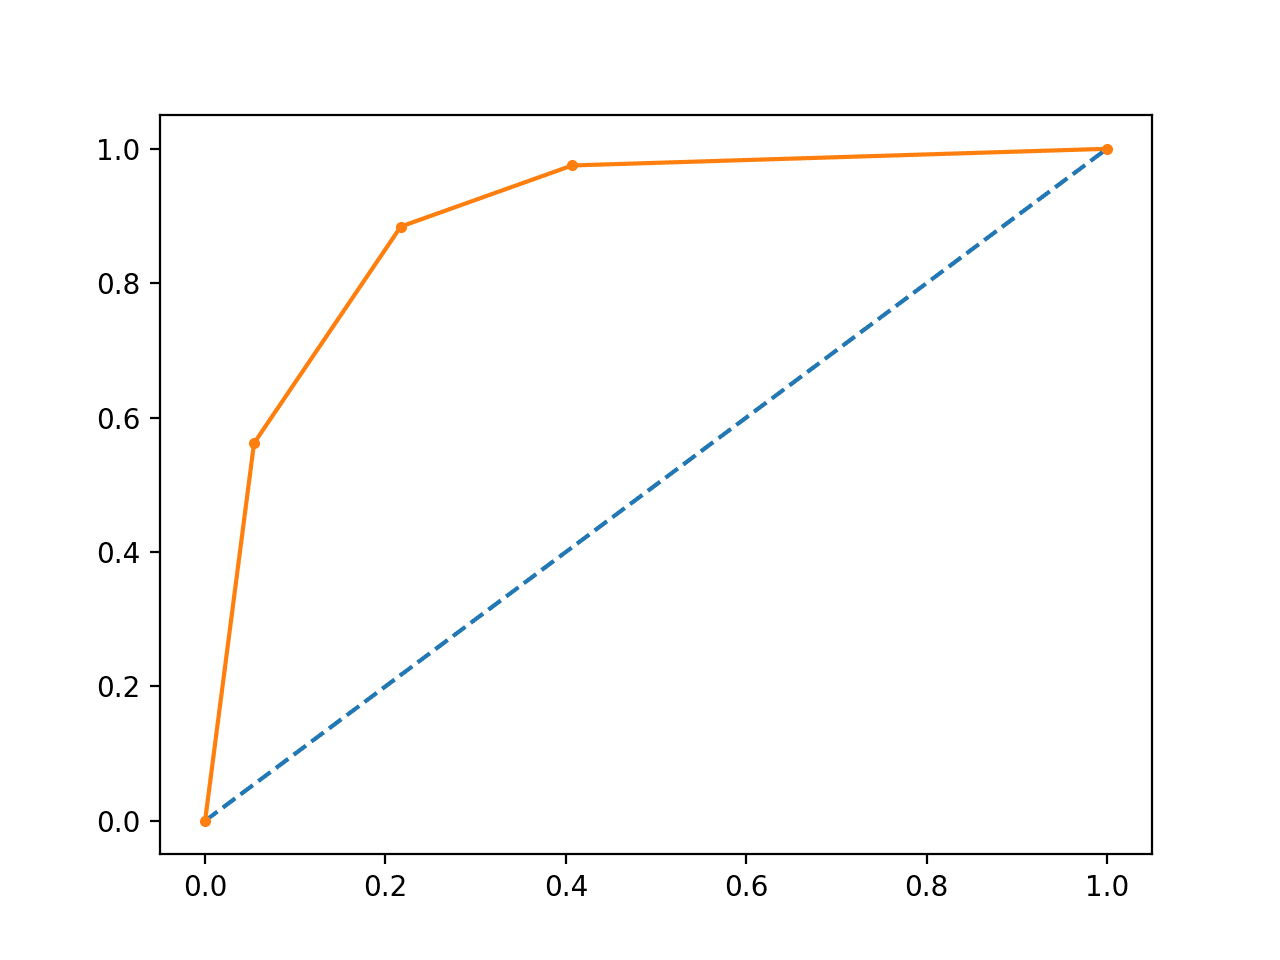
How to Fix FutureWarning Messages in scikit-learn

$
0
0

Upcoming changes to the scikit-learn library for machine learning are reported through the use of FutureWarning messages when the code is run.

Warning messages can be confusing to beginners as it looks like there is a problem with the code or that they have done something wrong. Warning messages are also not good for operational code as they can obscure errors and program output.

There are many ways to handle a warning message, including ignoring the message, suppressing warnings, and fixing the code.

In this tutorial, you will discover FutureWarning messages in the scikit-learn API and how to handle them in your own machine learning projects.

After completing this tutorial, you will know:

  • FutureWarning messages are designed to inform you about upcoming changes to default values for arguments in the scikit-learn API.
  • FutureWarning messages can be ignored or suppressed as they do not halt the execution of your program.
  • Examples of FutureWarning messages and how to interpret the message and change your code to address the upcoming change.

Let’s get started.

How to Fix FutureWarning Messages in scikit-learn

How to Fix FutureWarning Messages in scikit-learn
Photo by a.dombrowski, some rights reserved.

Tutorial Overview

This tutorial is divided into four parts; they are:

  1. Problem of FutureWarnings
  2. How to Suppress FutureWarnings
  3. How to Fix FutureWarnings
  4. FutureWarning Recommendations

Problem of FutureWarnings

The scikit-learn library is an open-source library that offers tools for data preparation and machine learning algorithms.

It is a widely used and constantly updated library.

Like many actively maintained software libraries, the APIs often change over time. This may be because better practices are discovered or preferred usage patterns change.

Most functions available in the scikit-learn API have one or more arguments that let you customize the behavior of the function. Many arguments have sensible defaults so that you don’t have to specify a value for the arguments. This is particularly helpful when you are starting out with machine learning or with scikit-learn and you don’t know what impact each of the arguments has.

Change to the scikit-learn API over time often comes in the form of changes to the sensible defaults to arguments to functions. Changes of this type are often not performed immediately; instead, they are planned.

For example, if your code was written for a prior version of the scikit-learn library and relies on a default value for a function argument and a subsequent version of the API plans to change this default value, then the API will alert you to the upcoming change.

This alert comes in the form of a warning message each time your code is run. Specifically, a “FutureWarning” is reported on standard error (e.g. on the command line).

This is a useful feature of the API and the project, designed for your benefit. It allows you to change your code ready for the next major release of the library to either retain the old behavior (specify a value for the argument) or adopt the new behavior (no change to your code).

A Python script that reports warnings when it runs can be frustrating.

  • For a beginner, it may feel like the code is not working correctly, that perhaps you have done something wrong.
  • For a professional, it is a sign of a program that requires updating.

In either case, warning messages may obscure real error messages or output from the program.

How to Suppress FutureWarnings

Warning messages are not error messages.

As such, a warning message reported by your program, such as a FutureWarning, will not halt the execution of your program. The warning message will be reported and the program will carry on executing.

You can, therefore, ignore the warning each time your code is executed, if you wish.

It is also possible to programmatically ignore the warning messages. This can be done by suppressing warning messages when your program is run.

This can be achieved by explicitly configuring the Python warning system to ignore warning messages of a specific type, such as ignore all FutureWarnings, or more generally, to ignore all warnings.

This can be achieved by adding the following block around your code that you know will generate warnings:

# run block of code and catch warnings
with warnings.catch_warnings():
	# ignore all caught warnings
	warnings.filterwarnings("ignore")
	# execute code that will generate warnings
	...

Or, if you have a very simple flat script (no functions or blocks), you can suppress all FutureWarnings by adding two lines to the top of your file:

# import warnings filter
from warnings import simplefilter
# ignore all future warnings
simplefilter(action='ignore', category=FutureWarning)

To learn more about suppressing in Python, see:

How to Fix FutureWarnings

Alternately, you can change your code to address the reported change to the scikit-learn API.

Typically, the warning message itself will instruct you on the nature of the change and how to change your code to address the warning.

Nevertheless, let’s look at a few recent examples of FutureWarnings that you may encounter and be struggling with.

The examples in this section were developed with scikit-learn version 0.20.2. You can check your scikit-learn version by running the following code:

# check scikit-learn version
import sklearn
print('sklearn: %s' % sklearn.__version__)

You will see output like the following:

sklearn: 0.20.2

As new versions of scikit-learn are released over time, the nature of the warning messages reported will change and new defaults will be adopted.

As such, although the examples below are specific to a version of scikit-learn, the approach to diagnosing and addressing the nature of each API change and provide good examples for handling future changes.

FutureWarning for LogisticRegression

The LogisticRegression algorithm has two recent changes to the default argument values that result in FutureWarning messages.

The first has to do with the solver for finding coefficients and the second has to do with how the model should be used to make multi-class classifications. Let’s look at each with code examples.

Changes to the Solver

The example below will generate a FutureWarning about the solver argument used by LogisticRegression.

# example of LogisticRegression that generates a FutureWarning
from sklearn.datasets import make_blobs
from sklearn.linear_model import LogisticRegression
# prepare dataset
X, y = make_blobs(n_samples=100, centers=2, n_features=2)
# create and configure model
model = LogisticRegression()
# fit model
model.fit(X, y)

Running the example results in the following warning message:

FutureWarning: Default solver will be changed to 'lbfgs' in 0.22. Specify a solver to silence this warning.

This issue involves a change from the ‘solver‘ argument that used to default to ‘liblinear‘ and will change to default to ‘lbfgs‘ in a future version. You must now specify the ‘solver‘ argument.

To maintain the old behavior, you can specify the argument as follows:

# create and configure model
model = LogisticRegression(solver='liblinear')

To support the new behavior (recommended), you can specify the argument as follows:

# create and configure model
model = LogisticRegression(solver='lbfgs')

Changes to the Multi-Class

The example below will generate a FutureWarning about the ‘multi_class‘ argument used by LogisticRegression.

# example of LogisticRegression that generates a FutureWarning
from sklearn.datasets import make_blobs
from sklearn.linear_model import LogisticRegression
# prepare dataset
X, y = make_blobs(n_samples=100, centers=3, n_features=2)
# create and configure model
model = LogisticRegression(solver='lbfgs')
# fit model
model.fit(X, y)

Running the example results in the following warning message:

FutureWarning: Default multi_class will be changed to 'auto' in 0.22. Specify the multi_class option to silence this warning.

This warning message only affects the use of logistic regression for multi-class classification problems, instead of the binary classification problems for which the method was designed.

The default of the ‘multi_class‘ argument is changing from ‘ovr‘ to ‘auto‘.

To maintain the old behavior, you can specify the argument as follows:

# create and configure model
model = LogisticRegression(solver='lbfgs', multi_class='ovr')

To support the new behavior (recommended), you can specify the argument as follows:

# create and configure model
model = LogisticRegression(solver='lbfgs', multi_class='auto')

FutureWarning for SVM

The support vector machine implementation has had a recent change to the ‘gamma‘ argument that results in a warning message, specifically the SVC and SVR classes.

The example below will generate a FutureWarning about the ‘gamma‘ argument used by SVC, but just as equally applies to SVR.

# example of SVC that generates a FutureWarning
from sklearn.datasets import make_blobs
from sklearn.svm import SVC
# prepare dataset
X, y = make_blobs(n_samples=100, centers=2, n_features=2)
# create and configure model
model = SVC()
# fit model
model.fit(X, y)

Running this example will generate the following warning message:

FutureWarning: The default value of gamma will change from 'auto' to 'scale' in version 0.22 to account better for unscaled features. Set gamma explicitly to 'auto' or 'scale' to avoid this warning.

This warning message reports that the default for the ‘gamma‘ argument is changing from the current value of ‘auto‘ to a new default value of ‘scale‘.

The gamma argument only impacts SVM models that use the RBF, Polynomial, or Sigmoid kernel.

The parameter controls the value of the ‘gamma‘ coefficient used in the algorithm and if you do not specify a value, a heuristic is used to specify the value. The warning is about a change in the way that the default will be calculated.

To maintain the old behavior, you can specify the argument as follows:

# create and configure model
model = SVC(gamma='auto')

To support the new behavior (recommended), you can specify the argument as follows:

# create and configure model
model = SVC(gamma='scale')

FutureWarning for Decision Tree Ensemble Algorithms

The decision-tree based ensemble algorithms will change the number of sub-models or trees used in the ensemble controlled by the ‘n_estimators‘ argument.

This affects models’ random forest and extra trees for classification and regression, specifically the classes: RandomForestClassifier, RandomForestRegressor, ExtraTreesClassifier, ExtraTreesRegressor, and RandomTreesEmbedding.

The example below will generate a FutureWarning about the ‘n_estimators‘ argument used by RandomForestClassifier, but just as equally applies to RandomForestRegressor and the extra trees classes.

# example of RandomForestClassifier that generates a FutureWarning
from sklearn.datasets import make_blobs
from sklearn.ensemble import RandomForestClassifier
# prepare dataset
X, y = make_blobs(n_samples=100, centers=2, n_features=2)
# create and configure model
model = RandomForestClassifier()
# fit model
model.fit(X, y)

Running this example will generate the following warning message:

FutureWarning: The default value of n_estimators will change from 10 in version 0.20 to 100 in 0.22.

This warning message reports that the number of submodels is increasing from 10 to 100, likely because computers are getting faster and 10 is very small, even 100 is small.

To maintain the old behavior, you can specify the argument as follows:

# create and configure model
model = RandomForestClassifier(n_estimators=10)

To support the new behavior (recommended), you can specify the argument as follows:

# create and configure model
model = RandomForestClassifier(n_estimators=100)

More Future Warnings?

Are you struggling with a FutureWarning that is not covered?

Let me know in the comments below and I will do my best to help.

FutureWarning Recommendations

Generally, I do not recommend ignoring or suppressing warning messages.

Ignoring warning messages means that the message may obscure real errors or program output and that API future changes may negatively impact your program unless you have considered them.

Suppressing warnings might be a quick fix for R&D work, but should not be used in a production system. Worse than simply ignoring the messages, suppressing the warnings may also suppress messages from other APIs.

Instead, I recommend that you fix the warning messages in your software.

How should you change your code?

In general, I recommend almost always adopting the new behavior of the API, e.g. the new default, unless you explicitly rely on the prior behavior of the function.

For long-lived operational or production code, it might be a good idea to explicitly specify all function arguments and not use defaults, as they might be subject to change in the future.

I also recommend that you keep your scikit-learn library up to date, and keep track of the changes to the API in each new release.

The easiest way to do this is to review the release notes for each release, available here:

Further Reading

This section provides more resources on the topic if you are looking to go deeper.

Summary

In this tutorial, you discovered FutureWarning messages in the scikit-learn API and how to handle them in your own machine learning projects.

Specifically, you learned:

  • FutureWarning messages are designed to inform you about upcoming changes to default values for arguments in the scikit-learn API.
  • FutureWarning messages can be ignored or suppressed as they do not halt the execution of your program.
  • Examples of FutureWarning messages and how to interpret the message and change your code to address the upcoming change.

Do you have any questions?
Ask your questions in the comments below and I will do my best to answer.

The post How to Fix FutureWarning Messages in scikit-learn appeared first on Machine Learning Mastery.
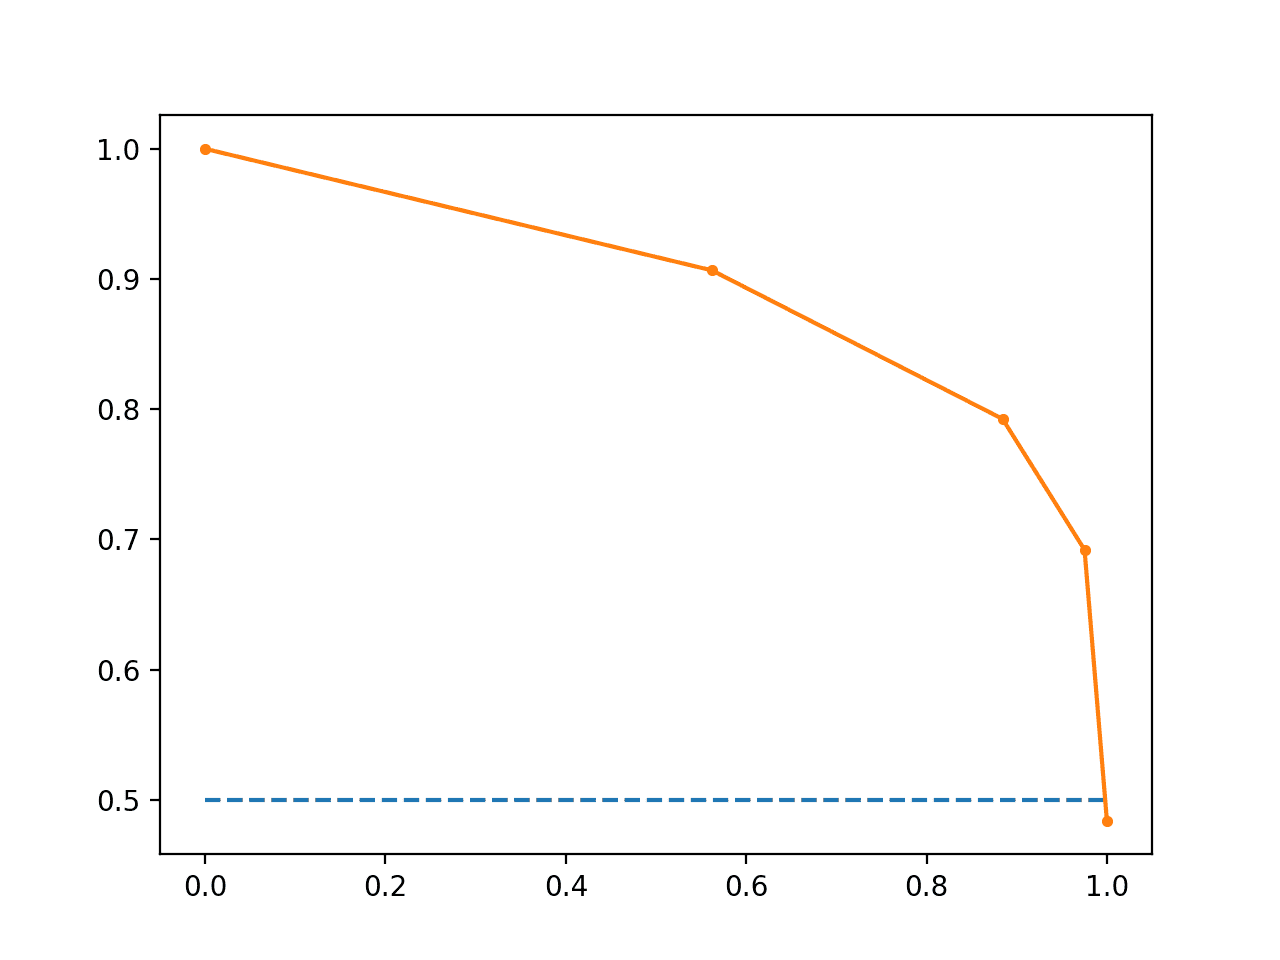
Python Machine Learning Mini-Course

$
0
0

From Developer to Machine Learning Practitioner in 14 Days

Python is one of the fastest-growing platforms for applied machine learning.

In this mini-course, you will discover how you can get started, build accurate models and confidently complete predictive modeling machine learning projects using Python in 14 days.

This is a big and important post. You might want to bookmark it.

Discover how to prepare data with pandas, fit and evaluate models with scikit-learn, and more in my new book, with 16 step-by-step tutorials, 3 projects, and full python code.

Let’s get started.

  • Update Oct/2016: Updated examples for sklearn v0.18.
  • Update Feb/2018: Update Python and library versions.
  • Update Mar/2018: Added alternate link to download some datasets as the originals appear to have been taken down.
  • Update May/2019: Fixed warning messages for latest version of scikit-learn .
Python Machine Learning Mini-Course

Python Machine Learning Mini-Course
Photo by Dave Young, some rights reserved.

Who Is This Mini-Course For?

Before we get started, let’s make sure you are in the right place.

The list below provides some general guidelines as to who this course was designed for.

Don’t panic if you don’t match these points exactly, you might just need to brush up in one area or another to keep up.

  • Developers that know how to write a little code. This means that it is not a big deal for you to pick up a new programming language like Python once you know the basic syntax. It does not mean you’re a wizard coder, just that you can follow a basic C-like language with little effort.
  • Developers that know a little machine learning. This means you know the basics of machine learning like cross-validation, some algorithms and the bias-variance trade-off. It does not mean that you are a machine learning Ph.D., just that you know the landmarks or know where to look them up.

This mini-course is neither a textbook on Python or a textbook on machine learning.

It will take you from a developer that knows a little machine learning to a developer who can get results using the Python ecosystem, the rising platform for professional machine learning.

Need help with Machine Learning in Python?

Take my free 2-week email course and discover data prep, algorithms and more (with code).

Click to sign-up now and also get a free PDF Ebook version of the course.

Start Your FREE Mini-Course Now!

Mini-Course Overview

This mini-course is broken down into 14 lessons.

You could complete one lesson per day (recommended) or complete all of the lessons in one day (hard core!). It really depends on the time you have available and your level of enthusiasm.

Below are 14 lessons that will get you started and productive with machine learning in Python:

  • Lesson 1: Download and Install Python and SciPy ecosystem.
  • Lesson 2: Get Around In Python, NumPy, Matplotlib and Pandas.
  • Lesson 3: Load Data From CSV.
  • Lesson 4: Understand Data with Descriptive Statistics.
  • Lesson 5: Understand Data with Visualization.
  • Lesson 6: Prepare For Modeling by Pre-Processing Data.
  • Lesson 7: Algorithm Evaluation With Resampling Methods.
  • Lesson 8: Algorithm Evaluation Metrics.
  • Lesson 9: Spot-Check Algorithms.
  • Lesson 10: Model Comparison and Selection.
  • Lesson 11: Improve Accuracy with Algorithm Tuning.
  • Lesson 12: Improve Accuracy with Ensemble Predictions.
  • Lesson 13: Finalize And Save Your Model.
  • Lesson 14: Hello World End-to-End Project.

Each lesson could take you 60 seconds or up to 30 minutes. Take your time and complete the lessons at your own pace. Ask questions and even post results in the comments below.

The lessons expect you to go off and find out how to do things. I will give you hints, but part of the point of each lesson is to force you to learn where to go to look for help on and about the Python platform (hint, I have all of the answers directly on this blog, use the search feature).

I do provide more help in the early lessons because I want you to build up some confidence and inertia.

Hang in there, don’t give up!

Lesson 1: Download and Install Python and SciPy

You cannot get started with machine learning in Python until you have access to the platform.

Today’s lesson is easy, you must download and install the Python 3.6 platform on your computer.

Visit the Python homepage and download Python for your operating system (Linux, OS X or Windows). Install Python on your computer. You may need to use a platform specific package manager such as macports on OS X or yum on RedHat Linux.

You also need to install the SciPy platform and the scikit-learn library. I recommend using the same approach that you used to install Python.

You can install everything at once (much easier) with Anaconda. Recommended for beginners.

Start Python for the first time by typing “python” at the command line.

Check the versions of everything you are going to need using the code below:

# Python version
import sys
print('Python: {}'.format(sys.version))
# scipy
import scipy
print('scipy: {}'.format(scipy.__version__))
# numpy
import numpy
print('numpy: {}'.format(numpy.__version__))
# matplotlib
import matplotlib
print('matplotlib: {}'.format(matplotlib.__version__))
# pandas
import pandas
print('pandas: {}'.format(pandas.__version__))
# scikit-learn
import sklearn
print('sklearn: {}'.format(sklearn.__version__))

If there are any errors, stop. Now is the time to fix them.

Need help? See this tutorial:

Lesson 2: Get Around In Python, NumPy, Matplotlib and Pandas.

You need to be able to read and write basic Python scripts.

As a developer, you can pick-up new programming languages pretty quickly. Python is case sensitive, uses hash (#) for comments and uses whitespace to indicate code blocks (whitespace matters).

Today’s task is to practice the basic syntax of the Python programming language and important SciPy data structures in the Python interactive environment.

  • Practice assignment, working with lists and flow control in Python.
  • Practice working with NumPy arrays.
  • Practice creating simple plots in Matplotlib.
  • Practice working with Pandas Series and DataFrames.

For example, below is a simple example of creating a Pandas DataFrame.

# dataframe
import numpy
import pandas
myarray = numpy.array([[1, 2, 3], [4, 5, 6]])
rownames = ['a', 'b']
colnames = ['one', 'two', 'three']
mydataframe = pandas.DataFrame(myarray, index=rownames, columns=colnames)
print(mydataframe)

Lesson 3: Load Data From CSV

Machine learning algorithms need data. You can load your own data from CSV files but when you are getting started with machine learning in Python you should practice on standard machine learning datasets.

Your task for today’s lesson is to get comfortable loading data into Python and to find and load standard machine learning datasets.

There are many excellent standard machine learning datasets in CSV format that you can download and practice with on the UCI machine learning repository.

  • Practice loading CSV files into Python using the CSV.reader() in the standard library.
  • Practice loading CSV files using NumPy and the numpy.loadtxt() function.
  • Practice loading CSV files using Pandas and the pandas.read_csv() function.

To get you started, below is a snippet that will load the Pima Indians onset of diabetes dataset using Pandas directly from the UCI Machine Learning Repository.

# Load CSV using Pandas from URL
import pandas
url = "https://raw.githubusercontent.com/jbrownlee/Datasets/master/pima-indians-diabetes.data.csv"
names = ['preg', 'plas', 'pres', 'skin', 'test', 'mass', 'pedi', 'age', 'class']
data = pandas.read_csv(url, names=names)
print(data.shape)

Well done for making it this far! Hang in there.

Any questions so far? Ask in the comments.

Lesson 4: Understand Data with Descriptive Statistics

Once you have loaded your data into Python you need to be able to understand it.

The better you can understand your data, the better and more accurate the models that you can build. The first step to understanding your data is to use descriptive statistics.

Today your lesson is to learn how to use descriptive statistics to understand your data. I recommend using the helper functions provided on the Pandas DataFrame.

  • Understand your data using the head() function to look at the first few rows.
  • Review the dimensions of your data with the shape property.
  • Look at the data types for each attribute with the dtypes property.
  • Review the distribution of your data with the describe() function.
  • Calculate pairwise correlation between your variables using the corr() function.

The below example loads the Pima Indians onset of diabetes dataset and summarizes the distribution of each attribute.

# Statistical Summary
import pandas
url = "https://raw.githubusercontent.com/jbrownlee/Datasets/master/pima-indians-diabetes.data.csv"
names = ['preg', 'plas', 'pres', 'skin', 'test', 'mass', 'pedi', 'age', 'class']
data = pandas.read_csv(url, names=names)
description = data.describe()
print(description)

Try it out!

Lesson 5: Understand Data with Visualization

Continuing on from yesterday’s lesson, you must spend time to better understand your data.

A second way to improve your understanding of your data is by using data visualization techniques (e.g. plotting).

Today, your lesson is to learn how to use plotting in Python to understand attributes alone and their interactions. Again, I recommend using the helper functions provided on the Pandas DataFrame.

  • Use the hist() function to create a histogram of each attribute.
  • Use the plot(kind=’box’) function to create box-and-whisker plots of each attribute.
  • Use the pandas.scatter_matrix() function to create pairwise scatterplots of all attributes.

For example, the snippet below will load the diabetes dataset and create a scatterplot matrix of the dataset.

# Scatter Plot Matrix
import matplotlib.pyplot as plt
import pandas
from pandas.plotting import scatter_matrix
url = "https://raw.githubusercontent.com/jbrownlee/Datasets/master/pima-indians-diabetes.data.csv"
names = ['preg', 'plas', 'pres', 'skin', 'test', 'mass', 'pedi', 'age', 'class']
data = pandas.read_csv(url, names=names)
scatter_matrix(data)
plt.show()

Sample Scatter Plot Matrix

Sample Scatter Plot Matrix

Lesson 6: Prepare For Modeling by Pre-Processing Data

Your raw data may not be setup to be in the best shape for modeling.

Sometimes you need to preprocess your data in order to best present the inherent structure of the problem in your data to the modeling algorithms. In today’s lesson, you will use the pre-processing capabilities provided by the scikit-learn.

The scikit-learn library provides two standard idioms for transforming data. Each transform is useful in different circumstances: Fit and Multiple Transform and Combined Fit-And-Transform.

There are many techniques that you can use to prepare your data for modeling. For example, try out some of the following

  • Standardize numerical data (e.g. mean of 0 and standard deviation of 1) using the scale and center options.
  • Normalize numerical data (e.g. to a range of 0-1) using the range option.
  • Explore more advanced feature engineering such as Binarizing.

For example, the snippet below loads the Pima Indians onset of diabetes dataset, calculates the parameters needed to standardize the data, then creates a standardized copy of the input data.

# Standardize data (0 mean, 1 stdev)
from sklearn.preprocessing import StandardScaler
import pandas
import numpy
url = "https://raw.githubusercontent.com/jbrownlee/Datasets/master/pima-indians-diabetes.data.csv"
names = ['preg', 'plas', 'pres', 'skin', 'test', 'mass', 'pedi', 'age', 'class']
dataframe = pandas.read_csv(url, names=names)
array = dataframe.values
# separate array into input and output components
X = array[:,0:8]
Y = array[:,8]
scaler = StandardScaler().fit(X)
rescaledX = scaler.transform(X)
# summarize transformed data
numpy.set_printoptions(precision=3)
print(rescaledX[0:5,:])

Lesson 7: Algorithm Evaluation With Resampling Methods

The dataset used to train a machine learning algorithm is called a training dataset. The dataset used to train an algorithm cannot be used to give you reliable estimates of the accuracy of the model on new data. This is a big problem because the whole idea of creating the model is to make predictions on new data.

You can use statistical methods called resampling methods to split your training dataset up into subsets, some are used to train the model and others are held back and used to estimate the accuracy of the model on unseen data.

Your goal with today’s lesson is to practice using the different resampling methods available in scikit-learn, for example:

  • Split a dataset into training and test sets.
  • Estimate the accuracy of an algorithm using k-fold cross validation.
  • Estimate the accuracy of an algorithm using leave one out cross validation.

The snippet below uses scikit-learn to estimate the accuracy of the Logistic Regression algorithm on the Pima Indians onset of diabetes dataset using 10-fold cross validation.

# Evaluate using Cross Validation
from pandas import read_csv
from sklearn.model_selection import KFold
from sklearn.model_selection import cross_val_score
from sklearn.linear_model import LogisticRegression
url = "https://raw.githubusercontent.com/jbrownlee/Datasets/master/pima-indians-diabetes.data.csv"
names = ['preg', 'plas', 'pres', 'skin', 'test', 'mass', 'pedi', 'age', 'class']
dataframe = read_csv(url, names=names)
array = dataframe.values
X = array[:,0:8]
Y = array[:,8]
kfold = KFold(n_splits=10, random_state=7)
model = LogisticRegression(solver='liblinear')
results = cross_val_score(model, X, Y, cv=kfold)
print("Accuracy: %.3f%% (%.3f%%)") % (results.mean()*100.0, results.std()*100.0)

What accuracy did you get? Let me know in the comments.

Did you realize that this is the halfway point? Well done!

Lesson 8: Algorithm Evaluation Metrics

There are many different metrics that you can use to evaluate the skill of a machine learning algorithm on a dataset.

You can specify the metric used for your test harness in scikit-learn via the cross_validation.cross_val_score() function and defaults can be used for regression and classification problems. Your goal with today’s lesson is to practice using the different algorithm performance metrics available in the scikit-learn package.

  • Practice using the Accuracy and LogLoss metrics on a classification problem.
  • Practice generating a confusion matrix and a classification report.
  • Practice using RMSE and RSquared metrics on a regression problem.

The snippet below demonstrates calculating the LogLoss metric on the Pima Indians onset of diabetes dataset.

# Cross Validation Classification LogLoss
from pandas import read_csv
from sklearn.model_selection import KFold
from sklearn.model_selection import cross_val_score
from sklearn.linear_model import LogisticRegression
url = "https://raw.githubusercontent.com/jbrownlee/Datasets/master/pima-indians-diabetes.data.csv"
names = ['preg', 'plas', 'pres', 'skin', 'test', 'mass', 'pedi', 'age', 'class']
dataframe = read_csv(url, names=names)
array = dataframe.values
X = array[:,0:8]
Y = array[:,8]
kfold = KFold(n_splits=10, random_state=7)
model = LogisticRegression(solver='liblinear')
scoring = 'neg_log_loss'
results = cross_val_score(model, X, Y, cv=kfold, scoring=scoring)
print("Logloss: %.3f (%.3f)") % (results.mean(), results.std())

What log loss did you get? Let me know in the comments.

Lesson 9: Spot-Check Algorithms

You cannot possibly know which algorithm will perform best on your data beforehand.

You have to discover it using a process of trial and error. I call this spot-checking algorithms. The scikit-learn library provides an interface to many machine learning algorithms and tools to compare the estimated accuracy of those algorithms.

In this lesson, you must practice spot checking different machine learning algorithms.

  • Spot check linear algorithms on a dataset (e.g. linear regression, logistic regression and linear discriminate analysis).
  • Spot check some non-linear algorithms on a dataset (e.g. KNN, SVM and CART).
  • Spot-check some sophisticated ensemble algorithms on a dataset (e.g. random forest and stochastic gradient boosting).

For example, the snippet below spot-checks the K-Nearest Neighbors algorithm on the Boston House Price dataset.

# KNN Regression
from pandas import read_csv
from sklearn.model_selection import KFold
from sklearn.model_selection import cross_val_score
from sklearn.neighbors import KNeighborsRegressor
url = "https://raw.githubusercontent.com/jbrownlee/Datasets/master/housing.data"
names = ['CRIM', 'ZN', 'INDUS', 'CHAS', 'NOX', 'RM', 'AGE', 'DIS', 'RAD', 'TAX', 'PTRATIO', 'B', 'LSTAT', 'MEDV']
dataframe = read_csv(url, delim_whitespace=True, names=names)
array = dataframe.values
X = array[:,0:13]
Y = array[:,13]
kfold = KFold(n_splits=10, random_state=7)
model = KNeighborsRegressor()
scoring = 'neg_mean_squared_error'
results = cross_val_score(model, X, Y, cv=kfold, scoring=scoring)
print(results.mean())

What mean squared error did you get? Let me know in the comments.

Lesson 10: Model Comparison and Selection

Now that you know how to spot check machine learning algorithms on your dataset, you need to know how to compare the estimated performance of different algorithms and select the best model.

In today’s lesson, you will practice comparing the accuracy of machine learning algorithms in Python with scikit-learn.

  • Compare linear algorithms to each other on a dataset.
  • Compare nonlinear algorithms to each other on a dataset.
  • Compare different configurations of the same algorithm to each other.
  • Create plots of the results comparing algorithms.

The example below compares Logistic Regression and Linear Discriminant Analysis to each other on the Pima Indians onset of diabetes dataset.

# Compare Algorithms
from pandas import read_csv
from sklearn.model_selection import KFold
from sklearn.model_selection import cross_val_score
from sklearn.linear_model import LogisticRegression
from sklearn.discriminant_analysis import LinearDiscriminantAnalysis
# load dataset
url = "https://raw.githubusercontent.com/jbrownlee/Datasets/master/pima-indians-diabetes.data.csv"
names = ['preg', 'plas', 'pres', 'skin', 'test', 'mass', 'pedi', 'age', 'class']
dataframe = read_csv(url, names=names)
array = dataframe.values
X = array[:,0:8]
Y = array[:,8]
# prepare models
models = []
models.append(('LR', LogisticRegression(solver='liblinear')))
models.append(('LDA', LinearDiscriminantAnalysis()))
# evaluate each model in turn
results = []
names = []
scoring = 'accuracy'
for name, model in models:
	kfold = KFold(n_splits=10, random_state=7)
	cv_results = cross_val_score(model, X, Y, cv=kfold, scoring=scoring)
	results.append(cv_results)
	names.append(name)
	msg = "%s: %f (%f)" % (name, cv_results.mean(), cv_results.std())
	print(msg)

Which algorithm got better results? Can you do better? Let me know in the comments.

Lesson 11: Improve Accuracy with Algorithm Tuning

Once you have found one or two algorithms that perform well on your dataset, you may want to improve the performance of those models.

One way to increase the performance of an algorithm is to tune its parameters to your specific dataset.

The scikit-learn library provides two ways to search for combinations of parameters for a machine learning algorithm. Your goal in today’s lesson is to practice each.

  • Tune the parameters of an algorithm using a grid search that you specify.
  • Tune the parameters of an algorithm using a random search.

The snippet below uses is an example of using a grid search for the Ridge Regression algorithm on the Pima Indians onset of diabetes dataset.

# Grid Search for Algorithm Tuning
from pandas import read_csv
import numpy
from sklearn.linear_model import Ridge
from sklearn.model_selection import GridSearchCV
url = "https://raw.githubusercontent.com/jbrownlee/Datasets/master/pima-indians-diabetes.data.csv"
names = ['preg', 'plas', 'pres', 'skin', 'test', 'mass', 'pedi', 'age', 'class']
dataframe = read_csv(url, names=names)
array = dataframe.values
X = array[:,0:8]
Y = array[:,8]
alphas = numpy.array([1,0.1,0.01,0.001,0.0001,0])
param_grid = dict(alpha=alphas)
model = Ridge()
grid = GridSearchCV(estimator=model, param_grid=param_grid, cv=3)
grid.fit(X, Y)
print(grid.best_score_)
print(grid.best_estimator_.alpha)

Which parameters achieved the best results? Can you do better? Let me know in the comments.

Lesson 12: Improve Accuracy with Ensemble Predictions

Another way that you can improve the performance of your models is to combine the predictions from multiple models.

Some models provide this capability built-in such as random forest for bagging and stochastic gradient boosting for boosting. Another type of ensembling called voting can be used to combine the predictions from multiple different models together.

In today’s lesson, you will practice using ensemble methods.

  • Practice bagging ensembles with the random forest and extra trees algorithms.
  • Practice boosting ensembles with the gradient boosting machine and AdaBoost algorithms.
  • Practice voting ensembles using by combining the predictions from multiple models together.

The snippet below demonstrates how you can use the Random Forest algorithm (a bagged ensemble of decision trees) on the Pima Indians onset of diabetes dataset.

# Random Forest Classification
from pandas import read_csv
from sklearn.model_selection import KFold
from sklearn.model_selection import cross_val_score
from sklearn.ensemble import RandomForestClassifier
url = "https://raw.githubusercontent.com/jbrownlee/Datasets/master/pima-indians-diabetes.data.csv"
names = ['preg', 'plas', 'pres', 'skin', 'test', 'mass', 'pedi', 'age', 'class']
dataframe = read_csv(url, names=names)
array = dataframe.values
X = array[:,0:8]
Y = array[:,8]
num_trees = 100
max_features = 3
kfold = KFold(n_splits=10, random_state=7)
model = RandomForestClassifier(n_estimators=num_trees, max_features=max_features)
results = cross_val_score(model, X, Y, cv=kfold)
print(results.mean())

Can you devise a better ensemble? Let me know in the comments.

Lesson 13: Finalize And Save Your Model

Once you have found a well-performing model on your machine learning problem, you need to finalize it.

In today’s lesson, you will practice the tasks related to finalizing your model.

Practice making predictions with your model on new data (data unseen during training and testing).
Practice saving trained models to file and loading them up again.

For example, the snippet below shows how you can create a Logistic Regression model, save it to file, then load it later and make predictions on unseen data.

# Save Model Using Pickle
from pandas import read_csv
from sklearn.model_selection import train_test_split
from sklearn.linear_model import LogisticRegression
import pickle
url = "https://raw.githubusercontent.com/jbrownlee/Datasets/master/pima-indians-diabetes.data.csv"
names = ['preg', 'plas', 'pres', 'skin', 'test', 'mass', 'pedi', 'age', 'class']
dataframe = read_csv(url, names=names)
array = dataframe.values
X = array[:,0:8]
Y = array[:,8]
test_size = 0.33
seed = 7
X_train, X_test, Y_train, Y_test = train_test_split(X, Y, test_size=test_size, random_state=seed)
# Fit the model on 33%
model = LogisticRegression(solver='liblinear')
model.fit(X_train, Y_train)
# save the model to disk
filename = 'finalized_model.sav'
pickle.dump(model, open(filename, 'wb'))

# some time later...

# load the model from disk
loaded_model = pickle.load(open(filename, 'rb'))
result = loaded_model.score(X_test, Y_test)
print(result)

Lesson 14: Hello World End-to-End Project

You now know how to complete each task of a predictive modeling machine learning problem.

In today’s lesson, you need to practice putting the pieces together and working through a standard machine learning dataset end-to-end.

Work through the iris dataset end-to-end (the hello world of machine learning)

This includes the steps:

  1. Understanding your data using descriptive statistics and visualization.
  2. Preprocessing the data to best expose the structure of the problem.
  3. Spot-checking a number of algorithms using your own test harness.
  4. Improving results using algorithm parameter tuning.
  5. Improving results using ensemble methods.
  6. Finalize the model ready for future use.

Take it slowly and record your results along the way.

What model did you use? What results did you get? Let me know in the comments.

The End!
(Look How Far You Have Come)

You made it. Well done!

Take a moment and look back at how far you have come.

  • You started off with an interest in machine learning and a strong desire to be able to practice and apply machine learning using Python.
  • You downloaded, installed and started Python, perhaps for the first time and started to get familiar with the syntax of the language.
  • Slowly and steadily over the course of a number of lessons you learned how the standard tasks of a predictive modeling machine learning project map onto the Python platform.
  • Building upon the recipes for common machine learning tasks you worked through your first machine learning problems end-to-end using Python.
  • Using a standard template, the recipes and experience you have gathered you are now capable of working through new and different predictive modeling machine learning problems on your own.

Don’t make light of this, you have come a long way in a short amount of time.

This is just the beginning of your machine learning journey with Python. Keep practicing and developing your skills.

Summary

How Did You Go With The Mini-Course?
Did you enjoy this mini-course?

Do you have any questions? Were there any sticking points?
Let me know. Leave a comment below.

The post Python Machine Learning Mini-Course appeared first on Machine Learning Mastery.
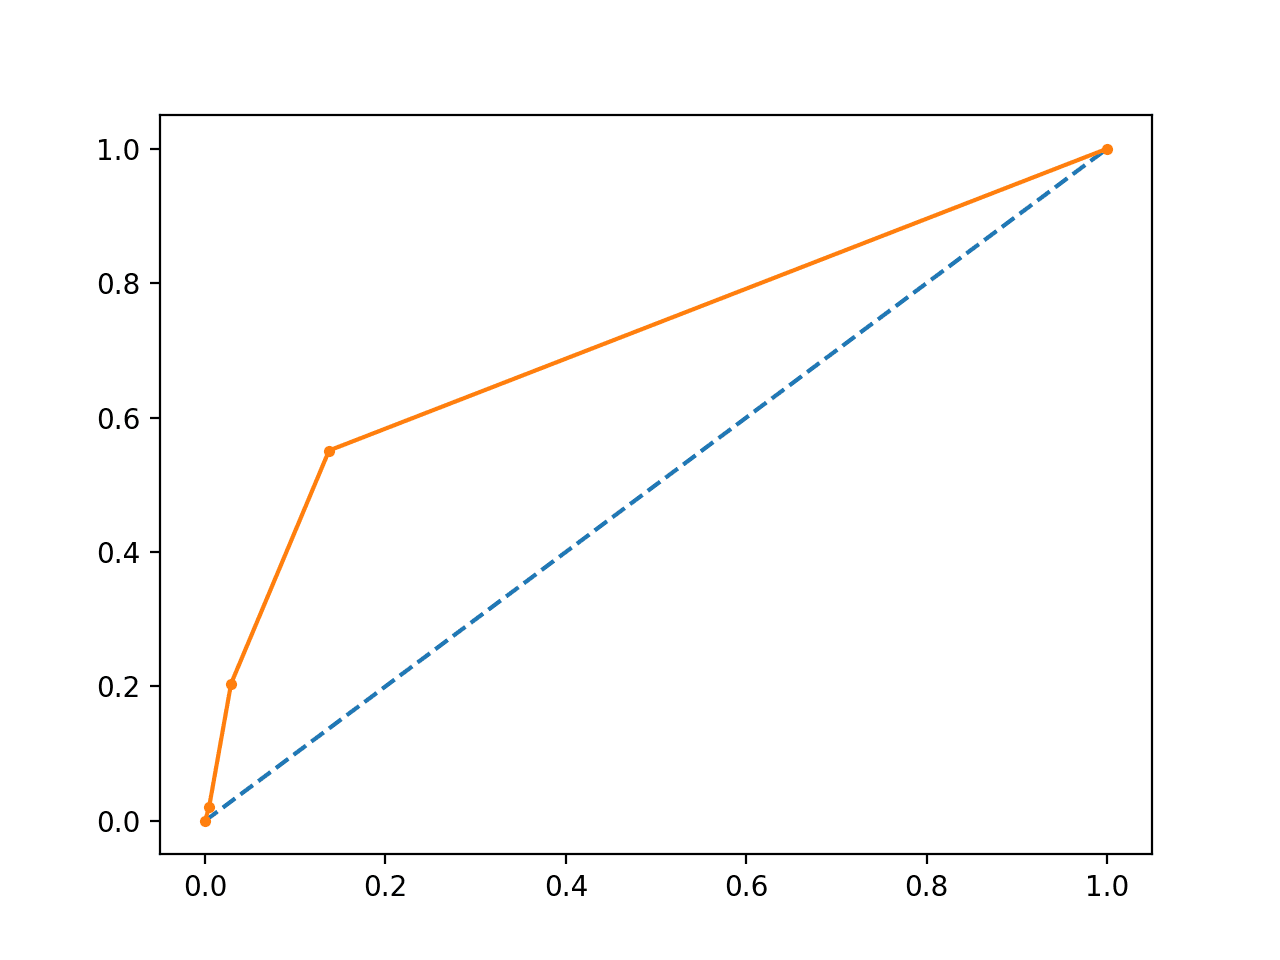
Python is the Growing Platform for Applied Machine Learning

$
0
0

You should pick the right tool for the job.

The specific predictive modeling problem that you are working on should dictate the specific programming language, libraries and even machine learning algorithms to use.

But, what if you are just getting started and looking for a platform to learn and practice machine learning?

In this post, you will discover that Python is the growing platform for applied machine learning, likely to outpace and topple R in terms of adoption and perhaps capability.

After reading this post you will know:

  • That search volume for Python machine learning is growing fast and has already outpaced R.
  • That the percentage of Python machine learning jobs is growing and has already outpaced R.
  • That Python is used by nearly 50% of polled practitioners and growing.

Discover how to prepare data with pandas, fit and evaluate models with scikit-learn, and more in my new book, with 16 step-by-step tutorials, 3 projects, and full python code.

Let’s get started.

Python for Machine Learning is Growing

Let’s look at 3 areas where we can see Python for machine learning growing:

  1. Search Volume.
  2. Job Ads.
  3. Professional Tool Usage.

Python Machine Learning Search Volume is Growing

Search volume is probably indicative of students, engineers and other practitioners searching for information to get started or go deeper into the topic.

Google provides a tool called Google Trends that gives insight into the search volume of keywords over time.

We can investigate the growth of “Python machine learning” from 2004 to 2016 (the last 12 years). Below is a graph of the change in search volume for this period:

Growth in Search Traffic for Python Machine Learning

Growth in Search Traffic for Python Machine Learning

We can see that the trend upward started in Perhaps 2012 with a steeper rise starting in 2015, likely boosted by Python Deep Learning tools like TensorFlow.

We can also contrast this to the search volume for R machine learning and we can see that from about the middle of 2015, Python machine learning has been beating out R.

Python Machine Learning vs R Machine Learning Search Volume

Python Machine Learning vs R Machine Learning Search Volume

Blue denotes “Python Machine Learning” and red denotes “R Machine Learning”.

Python Machine Learning Jobs are Growing

Indeed is a job search website and like Google trends, they show the volume of job ads that match keywords.

We can investigate the demand for “python machine learning jobs” for the last 4 years.

Growth on Python Machine Learning Jobs

Growth on Python Machine Learning Jobs

We can see time along the x-axis and the percentage of job postings that match the keyword. The graph shows almost linear growth from 2012 to 2015 with a hockey-stick like increase in 2016.

We can also compare the job ads for python and R.

Python Machine Learning Jobs vs R Machine Learning Jobs

Python Machine Learning Jobs vs R Machine Learning Jobs

Blue shows “Python machine learning” and orange shows “R machine learning”.

We see a more pronounced story compared to Google search volume. The percentage of job ads available to indeed.com shows that demand for Python machine learning skills has been dominating R machine learning skills since at least 2012 with the gap only widening in recent years.

KDNuggets Survey Results: More People Using Python for Machine Learning

We can get some insight into the tools used by machine learning practitioners by reviewing the results for the KDnuggets Software Poll Results.

Here’s a quote from the 2016 results:

R remains the leading tool, with 49% share, but Python grows faster and almost catches up to R.

— Gregory Piatetsky

The poll tracks the tools used by machine learning and data science professionals, where a participant can select more than one tool (which is the norm I would expect)

Here is the growth of Python for machine learning over the last 4 years:

2016   45.8%
2015   30.3%
2014   19.5%
2013   13.3%

Below is a plot of this growth.

KDNuggets Poll Results - Percentage of Professionals Using Python.png

KDNuggets Poll Results – Percentage of Professionals Using Python.png

We can see a near linear growth trend where Python s used by just under 50% of profesionals in 2016.

It is important to note that the number of participants in the poll has also grown from many hundreds to thousands in recent years and participants are self-selected.

What is interesting is that scikit-learn also appears separately on the poll, accounting for 17.2%.

For more information see: KDnuggets 2016 Software Poll Results.

O’Reilly Survey Results: More People Using Python for Machine Learning

O’Reilly performs an annual Data Science Salary Survey.

They collect a lot of data from professional data scientists and machine learning practitioners and present the results in very nice reports. For example, here is the 2016 Data Science Salary Survey report [View the PDF Report].

The survey tracks tool usage of practitioners, and as with the KDNuggets data.

Quoting from the key findings from the 2016 report, we can see that Python plays an important role in data science salary.

Python and Spark are among the tools that contribute most to salary.

— Page 1, 2016 Data Science Salary Survey report.

Reviewing the survey results, we can see a similar growth trend in use of the use of the Python ecosystem for machine learning over the last 4 years.

2016   54%
2015   51%
2014   42% (interpreted from graph)
2013   40%

Again, we can plot this growth.

O'Reilly Poll Results - Percentage of Professionals Using Python.png

O’Reilly Poll Results – Percentage of Professionals Using Python.png

It’s interesting that the 2016 results are very similar to those from the KDNuggets poll.

Quotes

You can find quotes to support any position on the Internet.

Take quotes with a grain of salt. Nevertheless, quotes can be insightful, raising and supporting points.

Let’s first take a look at some cherry-picked quotes from news sites and blogs about the growth of Python for machine learning.

News Quotes

Python has emerged over the past few years as a leader in data science programming. While there are still plenty of folks using R, SPSS, Julia or several other popular languages, Python’s growing popularity in the field is evident in the growth of its data science libraries.

— Katharine Jarmul, Introduction To Data Science: How To “big Data” With Python, Dataconomy

Our research shows that Python is one of the most popular languages for data science analyses, in use by more than one-third (36%) of organizations.

— Dave Menninger, Big Data Grows Up at Strata+Hadoop World 2016, SmartDataCollective

… the last few years have seen a proliferation of cutting-edge, commercially usable machine learning frameworks, including the highly successful scikit-learn Python library and well-publicized releases of libraries like Tensorflow by Google and CNTK by Microsoft Research.

— Josh Schwartz, Machine Learning Is No Longer Just for Experts, Harvard Business Review

Note that scikit-learn, TensorFlow and CNTK are all Python machine learning libraries.

Python is versatile, simple, easier to learn, and powerful because of its usefulness in a variety of contexts, some of which have nothing to do with data science. R is a specialized environment that looks to optimize for data analysis, but which is harder to learn. You’ll get paid more if you stick it out with R rather than working with Python

— Roger Huang, Data science sexiness: Your guide to Python and R, and which one is best, TheNextWeb

Quora Quotes

Below are some cherry picked quotes regarding the use of Python for machine learning taken from Quora questions.

Python if a popular scientific language and a rising star for machine learning. I’d be surprised if it can take the data analysis mantle from R, but matrix handling in NumPy may challenge MATLAB and communication tools like IPython are very attractive and a step into the future of reproducibility. I think the SciPy stack for machine learning and data analysis can be used for one-off projects (like papers), and frameworks like scikit-learn may be mature enough to be used in production systems.

— Aswath Muralidharan, Production Engineer. In response to the Quora question “What are the top 5 programming languages for Machine Learning?

I’d also recommend Python as it is a fantastic all-round programming language that is incredibly useful for drafting code fragments and exploring data (with the IPython shell), great for documenting steps and results in the analytical process chain (IPython Notebook), has a huge selection of libraries for almost any machine learning objective and can even be optimized for production system implementation. In my opinions there are languages that are superior to Python in any of these categories – but none of them offers this versatility.

— Benedikt Koehler, Founder & CEO DataLion. In response to the Quora question “What is the best language to use while learning machine learning for the first time?

[…] It is because the language can make a productive environment for people that just want to get something done quickly. It is fairly easy to wrap C libraries, and C++ is doable. This gives Python access to a wide range of existing code. Also the language doesn’t get in the way when it comes time to implement things. In many ways it makes coding “fun again” for a wide range of tasks.

— Shawn Masters, VP of Engineering. In response to the Quora question “Will Python become as popular as Java, given that Python is used in Machine Learning?

In my opinion, Python truly dominates this category. A quick search of almost any artificial intelligence, machine learning, NLP, or data analytics topic, plus ‘Python’, will return examples of useful, actively maintained libraries.

— Ryan Hill, programmer. In response to the Quora question “Which programming language has the best repository of machine learning libraries?

Summary

In this post, you discovered that Python is the growing platform for applied machine learning.

Specifically, you learned that:

  • The number of people interested in Python for machine learning is larger than R and is growing.
  • The number of jobs posted for Python machine learning skills is larger than R and growing.
  • The number of polled data science professionals that use Python is growing year over year.

Has this influenced your decision to get started with the
Python ecosystem for machine learning?

Share your thoughts in the comments below.

The post Python is the Growing Platform for Applied Machine Learning appeared first on Machine Learning Mastery.
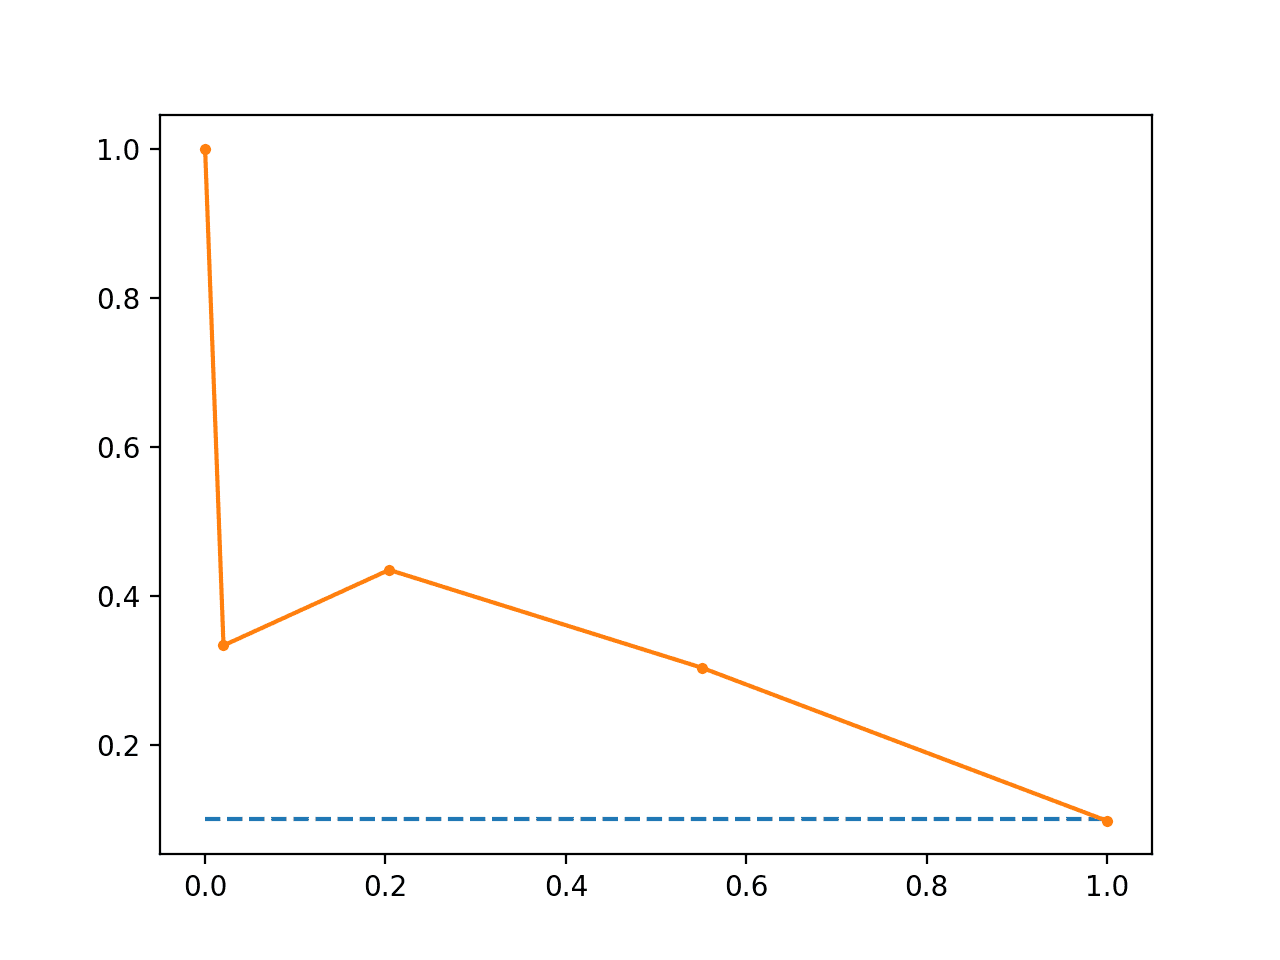
How to Create a Linux Virtual Machine For Machine Learning Development With Python 3

$
0
0

Linux is an excellent environment for machine learning development with Python.

The tools can be installed quickly and easily and you can develop and run large models directly.

In this tutorial, you will discover how to create and setup a Linux virtual machine for machine learning with Python.

After completing this tutorial, you will know:

  • How to download and install VirtualBox for managing virtual machines.
  • How to download and setup Fedora Linux.
  • How to install a SciPy environment for machine learning in Python 3.

This tutorial is suitable if your base operating system is Windows, Mac OS X, and Linux.

Discover how to prepare data with pandas, fit and evaluate models with scikit-learn, and more in my new book, with 16 step-by-step tutorials, 3 projects, and full python code.

Let’s get started.

Benefits of a Linux Virtual Machine

There are a number of reasons that you may want to use a Linux virtual machine for Python machine learning development.

For example, below is a list of 5 top benefits for using a virtual machine:

  • To use tools not available on your system (if you’re on Windows).
  • To install and use machine learning tools without impacting your local environment (e.g. use Python 3 tools).
  • To have highly customized environments for different projects (Python2 and Python3).
  • To save the state of the machine and pick up exactly where you left off (jump from machine to machine).
  • To share development environment with other developers (set-up once and reuse many times).

Perhaps the most beneficial point is the first, being able to easily use machine learning tools not supported on your environment.

I’m an OS X user, and even though machine learning tools can be installed using brew and macports, I still find it easier to setup and use Linux virtual machines for machine learning development.

Overview

This tutorial is broken down into 3 parts:

  1. Download and Install VirtualBox.
  2. Download and Install Fedora Linux in a Virtual Machine.
  3. Install Python Machine Learning Environment

1. Download and Install VirtualBox

VirtualBox is a free open source platform for creating and managing virtual machines.

Once installed, you can create all the virtual machines you like, as long as you have the ISO images or CDs to install from.

Download VirtualBox

Download VirtualBox

  • 3. Choose binaries for your workstation.
  • 4. Install the software for your system and follow the installation instructions.
Install VirtualBox

Install VirtualBox

  • 5. Open the VirtualBox software and confirm it works.
Start VirtualBox

Start VirtualBox

2. Download and Install Fedora Linux

I chose Fedora Linux because I think it is a kinder and gentler Linux than some.

It is a leading edge for RedHat Linux intended for workstations and developers.

2.1 Download the Fedora ISO Image

Let’s start off by downloading the ISO for Fedora Linux. In this case, the 64-bit version of Fedora 25.

Download Fedora

Download Fedora

  • 5. You should now have an ISO file with the name:
    • Fedora-Workstation-Live-x86_64-25-1.3.iso“.

We are now ready to create the VM in VirtualBox.

2.2 Create the Fedora Virtual Machine

Now, let’s create the Fedora virtual machine in VirtualBox.

  • 1. Open the VirtualBox software.
  • 2. Click “New” button.
  • 3. Select the Name and operating system.
    • name: Fedora25
    • type: Linux
    • version: Fedora (64-bit)
    • Click “Continue
Create Fedora VM Name and Operating System

Create Fedora VM Name and Operating System

  • 4. Configure the Memory Size
    • 2048
  • 5. Configure the Hard Disk
    • Create a virtual hard disk now
    • Hard disk file type
    • VDI (VirtualBox Disk Image)
    • Storage on physical hard disk
    • Dynamically allocated
    • File location and size: 10GB

We are now ready to install Fedora from the ISO image.

2.3 Install Fedora Linux

Now, let’s install Fedora Linux on the new virtual machine.

  • 1. Select the new virtual machine and click the “Start” button.
  • 2. Click Folder Icon and choose the Fedora ISO file:
    • Fedora-Workstation-Live-x86_64-25-1.3.iso“.
Install Fedora

Install Fedora

  • 3. Click the “Start” button.
  • 4. Select the first option “Start Fedora-Live-Workstation-Live 25” and press the Enter key.
  • 5. Hit the “Esc” key to skip the check.
  • 6. Select “Live System User“.
  • 7. Select “Install to Hard Drive“.
Install Fedora to Hard Drive

Install Fedora to Hard Drive

  • 8. Complete “Language Selection” (English)
  • 9. Complete “Installation Destination” (“ATA VBOX HARDDISK“).
    • You may need to wait one minute for the VM to create the hard disk.
Install on Virtual Hard Disk

Install on Virtual Hard Disk

  • 10. Click “Begin Installation“.
  • 11. Set root password.
  • 12. Create a user for yourself.
    • Note down the username and password (so that you can use it later).
    • Tick the “Make this user administrator” (so you can install software).
Create a New User

Create a New User

  • 13. Wait for the installation to complete… (5 minutes?)
  • 14. Click “Quit”, click power icon in top right; select power off.

2.4 Finalize Fedora Linux Installation

Fedora Linux has been installed; let’s finalize the installation and make it ready for use.

  • 1. In VirtualBox with the Fedora25 VM selected, under “Storage“, click on “Optical Drive“.
    • Select “Remove disk from virtual drive” to eject the ISO image.
  • 2. Click the “Start” button to start the Fedora Linux installation.
  • 3. Login as the user you created.
Fedora Login as New User

Fedora Login as New User

  • 4. Finalize installation
    • Choose language “English
    • Click “Next
    • Choose Keyboard “US
    • Click “Next
    • Configure Privacy
    • Click “Next
    • Connect Your Online Accounts
    • Click “Skip
    • Click “Start using Fedora
  • 5. Close the help system that starts automatically.

We now have a Fedora Linux virtual machine ready to install new software.

3. Install Python Machine Learning Environment

Fedora uses Gnome 3 as the window manager.

Gnome 3 is quite different to prior versions of Gnome; you can learn how to get around by using the built-in help system.

3.1 Install Python Environment

Let’s start off by installing the required Python libraries for machine learning development.

  • 1. Open the terminal.
    • Click “Activities
    • Type “terminal
    • Click icon or press enter
Start Terminal

Start Terminal

  • 2. Confirm Python3 was installed.

Type:

python3 --version

Python3 Version

Python3 Version

  • 3. Install the Python machine learning environment. Specifically:
    • NumPy
    • SciPy
    • Pandas
    • Matplotlib
    • Statsmodels
    • Scikit-Learn

DNF is the software installation system, formally yum. The first time you run dnf, it will update the database of packages, this might take a minute.

Type:

sudo dnf install python3-numpy python3-scipy python3-scikit-learn python3-pandas python3-matplotlib python3-statsmodels

Enter your password when prompted.

Confirm the installation when prompted by pressing “y” and “enter“.

3.2 Confirm Python Environment

Now that the environment is installed, we can confirm it by printing the versions of each required library.

  • 1. Open Gedit.
    • Click “Activities
    • Type “gedit
    • Click icon or press enter
  • 2. Type the following script and save it as versions.py in the home directory.

# scipy
import scipy
print('scipy: %s' % scipy.__version__)
# numpy
import numpy
print('numpy: %s' % numpy.__version__)
# matplotlib
import matplotlib
print('matplotlib: %s' % matplotlib.__version__)
# pandas
import pandas
print('pandas: %s' % pandas.__version__)
# scikit-learn
import sklearn
print('sklearn: %s' % sklearn.__version__)
# statsmodels
import statsmodels
print('statsmodels: %s' % statsmodels.__version__)

There is no copy-paste support; you may want to open Firefox within the VM and navigate to this page and copy paste the script into your Gedit window.

Write Versions Script

Write Versions Script

  • 3. Run the script in the terminal.

Type:

python3 versions.py

Python3 Check Library Versions

Python3 Check Library Versions

Tips For Using the VM

This section lists some tips using the VM for machine learning development.

  • Copy-paste and Folder Sharing. These features require the installation of “Guest Additions” in the Linux VM. I have not been able to get this to install correctly and therefore do not use these features. You can try if you like; let me know how you do in the comments.
  • Use GitHub. I recommend storing all of your code in GitHub and checking the code in and out from the VM. It makes life a lot easier for getting code and assets in and out of the VM.
  • Use Sublime. I think sublime is a great text editor on Linux for development, better than Gedit at least.
  • Use AWS for large jobs. You can use the same procedure to setup Fedora Linux on Amazon Web Services for running large models in the cloud.
  • VM Tools. You can save the VM at any point by closing the window. You can also take a snapshot of the VM at any point and return to the snapshot. This can be helpful if you are making large changes to the file system.
  • Python2. You can easily install Python2 alongside Python 3 in Linux and use the python (rather than python3) binary or use alternatives to switch between the two.
  • Notebooks. Consider running a notebook server inside the VM and opening up the firewall so that you can connect and run from your main workstation outside of the VM.

Do you have any tips to share? Let me know in the comments.

Further Reading

Below are some resources for further reading if you are new to the tools used in this tutorial.

Summary

In this tutorial, you discovered how to setup a Linux virtual machine for Python machine learning development.

Specifically, you learned:

  • How to download and install VirtualBox, free, open-source software for managing virtual machines.
  • How to download and setup Fedora Linux, a friendly Linux distribution for developers.
  • How to install and test a Python3 environment for machine learning development.

Did you complete the tutorial?
Let me know how it went in the comments below.

The post How to Create a Linux Virtual Machine For Machine Learning Development With Python 3 appeared first on Machine Learning Mastery.


Your First Machine Learning Project in Python Step-By-Step

$
0
0

Do you want to do machine learning using Python, but you’re having trouble getting started?

In this post, you will complete your first machine learning project using Python.

In this step-by-step tutorial you will:

  1. Download and install Python SciPy and get the most useful package for machine learning in Python.
  2. Load a dataset and understand it’s structure using statistical summaries and data visualization.
  3. Create 6 machine learning models, pick the best and build confidence that the accuracy is reliable.

If you are a machine learning beginner and looking to finally get started using Python, this tutorial was designed for you.

Discover how to prepare data with pandas, fit and evaluate models with scikit-learn, and more in my new book, with 16 step-by-step tutorials, 3 projects, and full python code.

Let’s get started!

  • Update Jan/2017: Updated to reflect changes to the scikit-learn API in version 0.18.
  • Update Mar/2017: Added links to help setup your Python environment.
  • Update Apr/2018: Added some helpful links about randomness and making predictions.
  • Update Sep/2018: Added link to my own hosted version of the dataset as UCI has become unreliable.
  • Update Feb/2019: Updated to address warnings with sklearn API version 0.20+ with SVM and Logistic Regression, also updated results and plots.
Your First Machine Learning Project in Python Step-By-Step

Your First Machine Learning Project in Python Step-By-Step
Photo by cosmoflash, some rights reserved.

How Do You Start Machine Learning in Python?

The best way to learn machine learning is by designing and completing small projects.

Python Can Be Intimidating When Getting Started

Python is a popular and powerful interpreted language. Unlike R, Python is a complete language and platform that you can use for both research and development and developing production systems.

There are also a lot of modules and libraries to choose from, providing multiple ways to do each task. It can feel overwhelming.

The best way to get started using Python for machine learning is to complete a project.

  • It will force you to install and start the Python interpreter (at the very least).
  • It will given you a bird’s eye view of how to step through a small project.
  • It will give you confidence, maybe to go on to your own small projects.

Beginners Need A Small End-to-End Project

Books and courses are frustrating. They give you lots of recipes and snippets, but you never get to see how they all fit together.

When you are applying machine learning to your own datasets, you are working on a project.

A machine learning project may not be linear, but it has a number of well known steps:

  1. Define Problem.
  2. Prepare Data.
  3. Evaluate Algorithms.
  4. Improve Results.
  5. Present Results.

The best way to really come to terms with a new platform or tool is to work through a machine learning project end-to-end and cover the key steps. Namely, from loading data, summarizing data, evaluating algorithms and making some predictions.

If you can do that, you have a template that you can use on dataset after dataset. You can fill in the gaps such as further data preparation and improving result tasks later, once you have more confidence.

Hello World of Machine Learning

The best small project to start with on a new tool is the classification of iris flowers (e.g. the iris dataset).

This is a good project because it is so well understood.

  • Attributes are numeric so you have to figure out how to load and handle data.
  • It is a classification problem, allowing you to practice with perhaps an easier type of supervised learning algorithm.
  • It is a multi-class classification problem (multi-nominal) that may require some specialized handling.
  • It only has 4 attributes and 150 rows, meaning it is small and easily fits into memory (and a screen or A4 page).
  • All of the numeric attributes are in the same units and the same scale, not requiring any special scaling or transforms to get started.

Let’s get started with your hello world machine learning project in Python.

Machine Learning in Python: Step-By-Step Tutorial
(start here)

In this section, we are going to work through a small machine learning project end-to-end.

Here is an overview of what we are going to cover:

  1. Installing the Python and SciPy platform.
  2. Loading the dataset.
  3. Summarizing the dataset.
  4. Visualizing the dataset.
  5. Evaluating some algorithms.
  6. Making some predictions.

Take your time. Work through each step.

Try to type in the commands yourself or copy-and-paste the commands to speed things up.

If you have any questions at all, please leave a comment at the bottom of the post.

Need help with Machine Learning in Python?

Take my free 2-week email course and discover data prep, algorithms and more (with code).

Click to sign-up now and also get a free PDF Ebook version of the course.

Start Your FREE Mini-Course Now!

1. Downloading, Installing and Starting Python SciPy

Get the Python and SciPy platform installed on your system if it is not already.

I do not want to cover this in great detail, because others already have. This is already pretty straightforward, especially if you are a developer. If you do need help, ask a question in the comments.

1.1 Install SciPy Libraries

This tutorial assumes Python version 2.7 or 3.5+.

There are 5 key libraries that you will need to install. Below is a list of the Python SciPy libraries required for this tutorial:

  • scipy
  • numpy
  • matplotlib
  • pandas
  • sklearn

There are many ways to install these libraries. My best advice is to pick one method then be consistent in installing each library.

The scipy installation page provides excellent instructions for installing the above libraries on multiple different platforms, such as Linux, mac OS X and Windows. If you have any doubts or questions, refer to this guide, it has been followed by thousands of people.

  • On Mac OS X, you can use macports to install Python 2.7 and these libraries. For more information on macports, see the homepage.
  • On Linux you can use your package manager, such as yum on Fedora to install RPMs.

If you are on Windows or you are not confident, I would recommend installing the free version of Anaconda that includes everything you need.

Note: This tutorial assumes you have scikit-learn version 0.18 or higher installed.

Need more help? See one of these tutorials:

1.2 Start Python and Check Versions

It is a good idea to make sure your Python environment was installed successfully and is working as expected.

The script below will help you test out your environment. It imports each library required in this tutorial and prints the version.

Open a command line and start the python interpreter:

python

I recommend working directly in the interpreter or writing your scripts and running them on the command line rather than big editors and IDEs. Keep things simple and focus on the machine learning not the toolchain.

Type or copy and paste the following script:

# Check the versions of libraries

# Python version
import sys
print('Python: {}'.format(sys.version))
# scipy
import scipy
print('scipy: {}'.format(scipy.__version__))
# numpy
import numpy
print('numpy: {}'.format(numpy.__version__))
# matplotlib
import matplotlib
print('matplotlib: {}'.format(matplotlib.__version__))
# pandas
import pandas
print('pandas: {}'.format(pandas.__version__))
# scikit-learn
import sklearn
print('sklearn: {}'.format(sklearn.__version__))

Here is the output I get on my OS X workstation:

Python: 3.6.8 (default, Dec 30 2018, 13:01:55) 
[GCC 4.2.1 Compatible Apple LLVM 9.1.0 (clang-902.0.39.2)]
scipy: 1.1.0
numpy: 1.15.4
matplotlib: 3.0.2
pandas: 0.23.4
sklearn: 0.20.2

Compare the above output to your versions.

Ideally, your versions should match or be more recent. The APIs do not change quickly, so do not be too concerned if you are a few versions behind, Everything in this tutorial will very likely still work for you.

If you get an error, stop. Now is the time to fix it.

If you cannot run the above script cleanly you will not be able to complete this tutorial.

My best advice is to Google search for your error message or post a question on Stack Exchange.

2. Load The Data

We are going to use the iris flowers dataset. This dataset is famous because it is used as the “hello world” dataset in machine learning and statistics by pretty much everyone.

The dataset contains 150 observations of iris flowers. There are four columns of measurements of the flowers in centimeters. The fifth column is the species of the flower observed. All observed flowers belong to one of three species.

You can learn more about this dataset on Wikipedia.

In this step we are going to load the iris data from CSV file URL.

2.1 Import libraries

First, let’s import all of the modules, functions and objects we are going to use in this tutorial.

# Load libraries
import pandas
from pandas.plotting import scatter_matrix
import matplotlib.pyplot as plt
from sklearn import model_selection
from sklearn.metrics import classification_report
from sklearn.metrics import confusion_matrix
from sklearn.metrics import accuracy_score
from sklearn.linear_model import LogisticRegression
from sklearn.tree import DecisionTreeClassifier
from sklearn.neighbors import KNeighborsClassifier
from sklearn.discriminant_analysis import LinearDiscriminantAnalysis
from sklearn.naive_bayes import GaussianNB
from sklearn.svm import SVC

Everything should load without error. If you have an error, stop. You need a working SciPy environment before continuing. See the advice above about setting up your environment.

2.2 Load Dataset

We can load the data directly from the UCI Machine Learning repository.

We are using pandas to load the data. We will also use pandas next to explore the data both with descriptive statistics and data visualization.

Note that we are specifying the names of each column when loading the data. This will help later when we explore the data.

# Load dataset
url = "https://raw.githubusercontent.com/jbrownlee/Datasets/master/iris.csv"
names = ['sepal-length', 'sepal-width', 'petal-length', 'petal-width', 'class']
dataset = pandas.read_csv(url, names=names)

The dataset should load without incident.

If you do have network problems, you can download the iris.csv file into your working directory and load it using the same method, changing URL to the local file name.

3. Summarize the Dataset

Now it is time to take a look at the data.

In this step we are going to take a look at the data a few different ways:

  1. Dimensions of the dataset.
  2. Peek at the data itself.
  3. Statistical summary of all attributes.
  4. Breakdown of the data by the class variable.

Don’t worry, each look at the data is one command. These are useful commands that you can use again and again on future projects.

3.1 Dimensions of Dataset

We can get a quick idea of how many instances (rows) and how many attributes (columns) the data contains with the shape property.

# shape
print(dataset.shape)

You should see 150 instances and 5 attributes:

(150, 5)

3.2 Peek at the Data

It is also always a good idea to actually eyeball your data.

# head
print(dataset.head(20))

You should see the first 20 rows of the data:

sepal-length  sepal-width  petal-length  petal-width        class
0            5.1          3.5           1.4          0.2  Iris-setosa
1            4.9          3.0           1.4          0.2  Iris-setosa
2            4.7          3.2           1.3          0.2  Iris-setosa
3            4.6          3.1           1.5          0.2  Iris-setosa
4            5.0          3.6           1.4          0.2  Iris-setosa
5            5.4          3.9           1.7          0.4  Iris-setosa
6            4.6          3.4           1.4          0.3  Iris-setosa
7            5.0          3.4           1.5          0.2  Iris-setosa
8            4.4          2.9           1.4          0.2  Iris-setosa
9            4.9          3.1           1.5          0.1  Iris-setosa
10           5.4          3.7           1.5          0.2  Iris-setosa
11           4.8          3.4           1.6          0.2  Iris-setosa
12           4.8          3.0           1.4          0.1  Iris-setosa
13           4.3          3.0           1.1          0.1  Iris-setosa
14           5.8          4.0           1.2          0.2  Iris-setosa
15           5.7          4.4           1.5          0.4  Iris-setosa
16           5.4          3.9           1.3          0.4  Iris-setosa
17           5.1          3.5           1.4          0.3  Iris-setosa
18           5.7          3.8           1.7          0.3  Iris-setosa
19           5.1          3.8           1.5          0.3  Iris-setosa

3.3 Statistical Summary

Now we can take a look at a summary of each attribute.

This includes the count, mean, the min and max values as well as some percentiles.

# descriptions
print(dataset.describe())

We can see that all of the numerical values have the same scale (centimeters) and similar ranges between 0 and 8 centimeters.

sepal-length  sepal-width  petal-length  petal-width
count    150.000000   150.000000    150.000000   150.000000
mean       5.843333     3.054000      3.758667     1.198667
std        0.828066     0.433594      1.764420     0.763161
min        4.300000     2.000000      1.000000     0.100000
25%        5.100000     2.800000      1.600000     0.300000
50%        5.800000     3.000000      4.350000     1.300000
75%        6.400000     3.300000      5.100000     1.800000
max        7.900000     4.400000      6.900000     2.500000

3.4 Class Distribution

Let’s now take a look at the number of instances (rows) that belong to each class. We can view this as an absolute count.

# class distribution
print(dataset.groupby('class').size())

We can see that each class has the same number of instances (50 or 33% of the dataset).

class
Iris-setosa        50
Iris-versicolor    50
Iris-virginica     50

4. Data Visualization

We now have a basic idea about the data. We need to extend that with some visualizations.

We are going to look at two types of plots:

  1. Univariate plots to better understand each attribute.
  2. Multivariate plots to better understand the relationships between attributes.

4.1 Univariate Plots

We start with some univariate plots, that is, plots of each individual variable.

Given that the input variables are numeric, we can create box and whisker plots of each.

# box and whisker plots
dataset.plot(kind='box', subplots=True, layout=(2,2), sharex=False, sharey=False)
plt.show()

This gives us a much clearer idea of the distribution of the input attributes:

Box and Whisker Plots for Each Input Variable for the Iris Flowers Dataset

Box and Whisker Plots for Each Input Variable for the Iris Flowers Dataset

We can also create a histogram of each input variable to get an idea of the distribution.

# histograms
dataset.hist()
plt.show()

It looks like perhaps two of the input variables have a Gaussian distribution. This is useful to note as we can use algorithms that can exploit this assumption.

Histogram Plots for Each Input Variable for the Iris Flowers Dataset

Histogram Plots for Each Input Variable for the Iris Flowers Dataset

4.2 Multivariate Plots

Now we can look at the interactions between the variables.

First, let’s look at scatterplots of all pairs of attributes. This can be helpful to spot structured relationships between input variables.

# scatter plot matrix
scatter_matrix(dataset)
plt.show()

Note the diagonal grouping of some pairs of attributes. This suggests a high correlation and a predictable relationship.

Scatter Matrix Plot for Each Input Variable for the Iris Flowers Dataset

Scatter Matrix Plot for Each Input Variable for the Iris Flowers Dataset

5. Evaluate Some Algorithms

Now it is time to create some models of the data and estimate their accuracy on unseen data.

Here is what we are going to cover in this step:

  1. Separate out a validation dataset.
  2. Set-up the test harness to use 10-fold cross validation.
  3. Build 5 different models to predict species from flower measurements
  4. Select the best model.

5.1 Create a Validation Dataset

We need to know that the model we created is any good.

Later, we will use statistical methods to estimate the accuracy of the models that we create on unseen data. We also want a more concrete estimate of the accuracy of the best model on unseen data by evaluating it on actual unseen data.

That is, we are going to hold back some data that the algorithms will not get to see and we will use this data to get a second and independent idea of how accurate the best model might actually be.

We will split the loaded dataset into two, 80% of which we will use to train our models and 20% that we will hold back as a validation dataset.

# Split-out validation dataset
array = dataset.values
X = array[:,0:4]
Y = array[:,4]
validation_size = 0.20
seed = 7
X_train, X_validation, Y_train, Y_validation = model_selection.train_test_split(X, Y, test_size=validation_size, random_state=seed)

You now have training data in the X_train and Y_train for preparing models and a X_validation and Y_validation sets that we can use later.

Notice that we used a python slice to select the columns in the NumPy array. If this is new to you, you might want to check-out this post:

5.2 Test Harness

We will use 10-fold cross validation to estimate accuracy.

This will split our dataset into 10 parts, train on 9 and test on 1 and repeat for all combinations of train-test splits.

# Test options and evaluation metric
seed = 7
scoring = 'accuracy'

The specific random seed does not matter, learn more about pseudorandom number generators here:

We are using the metric of ‘accuracy‘ to evaluate models. This is a ratio of the number of correctly predicted instances in divided by the total number of instances in the dataset multiplied by 100 to give a percentage (e.g. 95% accurate). We will be using the scoring variable when we run build and evaluate each model next.

5.3 Build Models

We don’t know which algorithms would be good on this problem or what configurations to use. We get an idea from the plots that some of the classes are partially linearly separable in some dimensions, so we are expecting generally good results.

Let’s evaluate 6 different algorithms:

  • Logistic Regression (LR)
  • Linear Discriminant Analysis (LDA)
  • K-Nearest Neighbors (KNN).
  • Classification and Regression Trees (CART).
  • Gaussian Naive Bayes (NB).
  • Support Vector Machines (SVM).

This is a good mixture of simple linear (LR and LDA), nonlinear (KNN, CART, NB and SVM) algorithms. We reset the random number seed before each run to ensure that the evaluation of each algorithm is performed using exactly the same data splits. It ensures the results are directly comparable.

Let’s build and evaluate our models:

# Spot Check Algorithms
models = []
models.append(('LR', LogisticRegression(solver='liblinear', multi_class='ovr')))
models.append(('LDA', LinearDiscriminantAnalysis()))
models.append(('KNN', KNeighborsClassifier()))
models.append(('CART', DecisionTreeClassifier()))
models.append(('NB', GaussianNB()))
models.append(('SVM', SVC(gamma='auto')))
# evaluate each model in turn
results = []
names = []
for name, model in models:
	kfold = model_selection.KFold(n_splits=10, random_state=seed)
	cv_results = model_selection.cross_val_score(model, X_train, Y_train, cv=kfold, scoring=scoring)
	results.append(cv_results)
	names.append(name)
	msg = "%s: %f (%f)" % (name, cv_results.mean(), cv_results.std())
	print(msg)

5.4 Select Best Model

We now have 6 models and accuracy estimations for each. We need to compare the models to each other and select the most accurate.

Running the example above, we get the following raw results:

LR: 0.966667 (0.040825)
LDA: 0.975000 (0.038188)
KNN: 0.983333 (0.033333)
CART: 0.975000 (0.038188)
NB: 0.975000 (0.053359)
SVM: 0.991667 (0.025000)

Note, you’re results may differ. For more on this see the post:

In this case, we can see that it looks like Support Vector Machines (SVM) has the largest estimated accuracy score.

We can also create a plot of the model evaluation results and compare the spread and the mean accuracy of each model. There is a population of accuracy measures for each algorithm because each algorithm was evaluated 10 times (10 fold cross validation).

# Compare Algorithms
fig = plt.figure()
fig.suptitle('Algorithm Comparison')
ax = fig.add_subplot(111)
plt.boxplot(results)
ax.set_xticklabels(names)
plt.show()

You can see that the box and whisker plots are squashed at the top of the range, with many samples achieving 100% accuracy.

Box and Whisker Plot Comparing Machine Learning Algorithms on the Iris Flowers Dataset

Box and Whisker Plot Comparing Machine Learning Algorithms on the Iris Flowers Dataset

6. Make Predictions

The KNN algorithm is very simple and was an accurate model based on our tests. Now we want to get an idea of the accuracy of the model on our validation set.

This will give us an independent final check on the accuracy of the best model. It is valuable to keep a validation set just in case you made a slip during training, such as overfitting to the training set or a data leak. Both will result in an overly optimistic result.

We can run the KNN model directly on the validation set and summarize the results as a final accuracy score, a confusion matrix and a classification report.

# Make predictions on validation dataset
knn = KNeighborsClassifier()
knn.fit(X_train, Y_train)
predictions = knn.predict(X_validation)
print(accuracy_score(Y_validation, predictions))
print(confusion_matrix(Y_validation, predictions))
print(classification_report(Y_validation, predictions))

We can see that the accuracy is 0.9 or 90%. The confusion matrix provides an indication of the three errors made. Finally, the classification report provides a breakdown of each class by precision, recall, f1-score and support showing excellent results (granted the validation dataset was small).

0.9
[[ 7  0  0]
 [ 0 11  1]
 [ 0  2  9]]
                 precision    recall  f1-score   support

    Iris-setosa       1.00      1.00      1.00         7
Iris-versicolor       0.85      0.92      0.88        12
 Iris-virginica       0.90      0.82      0.86        11

      micro avg       0.90      0.90      0.90        30
      macro avg       0.92      0.91      0.91        30
   weighted avg       0.90      0.90      0.90        30

You can learn more about how to make predictions and predict probabilities here:

You Can Do Machine Learning in Python

Work through the tutorial above. It will take you 5-to-10 minutes, max!

You do not need to understand everything. (at least not right now) Your goal is to run through the tutorial end-to-end and get a result. You do not need to understand everything on the first pass. List down your questions as you go. Make heavy use of the help(“FunctionName”) help syntax in Python to learn about all of the functions that you’re using.

You do not need to know how the algorithms work. It is important to know about the limitations and how to configure machine learning algorithms. But learning about algorithms can come later. You need to build up this algorithm knowledge slowly over a long period of time. Today, start off by getting comfortable with the platform.

You do not need to be a Python programmer. The syntax of the Python language can be intuitive if you are new to it. Just like other languages, focus on function calls (e.g. function()) and assignments (e.g. a = “b”). This will get you most of the way. You are a developer, you know how to pick up the basics of a language real fast. Just get started and dive into the details later.

You do not need to be a machine learning expert. You can learn about the benefits and limitations of various algorithms later, and there are plenty of posts that you can read later to brush up on the steps of a machine learning project and the importance of evaluating accuracy using cross validation.

What about other steps in a machine learning project. We did not cover all of the steps in a machine learning project because this is your first project and we need to focus on the key steps. Namely, loading data, looking at the data, evaluating some algorithms and making some predictions. In later tutorials we can look at other data preparation and result improvement tasks.

Summary

In this post, you discovered step-by-step how to complete your first machine learning project in Python.

You discovered that completing a small end-to-end project from loading the data to making predictions is the best way to get familiar with a new platform.

Your Next Step

Do you work through the tutorial?

  1. Work through the above tutorial.
  2. List any questions you have.
  3. Search-for or research the answers.
  4. Remember, you can use the help(“FunctionName”) in Python to get help on any function.

Do you have a question?
Post it in the comments below.

The post Your First Machine Learning Project in Python Step-By-Step appeared first on Machine Learning Mastery.
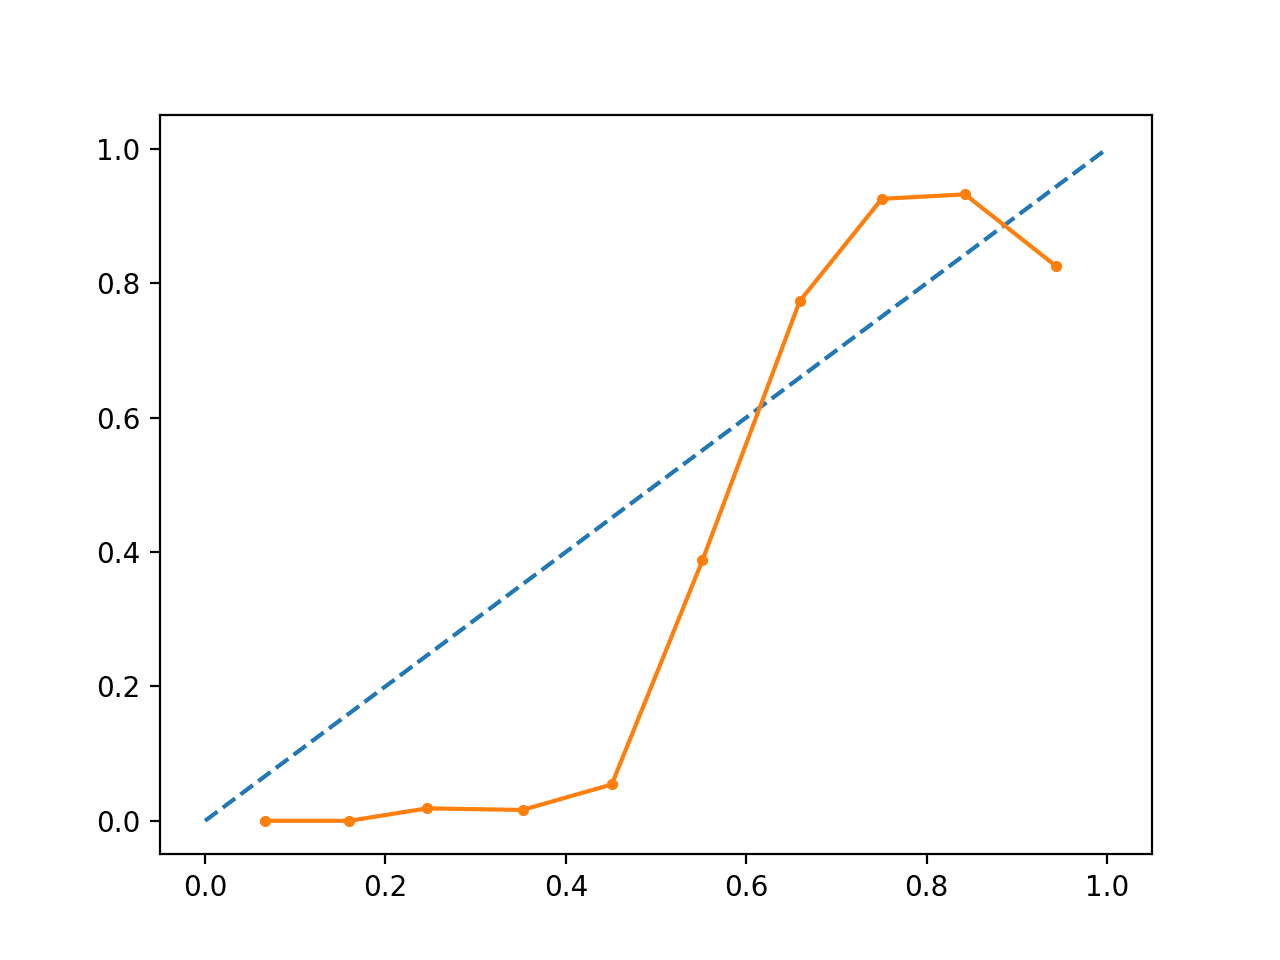
How to Save a NumPy Array to File for Machine Learning

$
0
0

Developing machine learning models in Python often requires the use of NumPy arrays.

NumPy arrays are efficient data structures for working with data in Python, and machine learning models like those in the scikit-learn library, and deep learning models like those in the Keras library, expect input data in the format of NumPy arrays and make predictions in the format of NumPy arrays.

As such, it is common to need to save NumPy arrays to file.

For example, you may prepare your data with transforms like scaling and need to save it to file for later use. You may also use a model to make predictions and need to save the predictions to file for later use.

In this tutorial, you will discover how to save your NumPy arrays to file.

After completing this tutorial, you will know:

  • How to save NumPy arrays to CSV formatted files.
  • How to save NumPy arrays to NPY formatted files.
  • How to save NumPy arrays to compressed NPZ formatted files.

Let’s get started.

How to Save a NumPy Array to File for Machine Learning

How to Save a NumPy Array to File for Machine Learning
Photo by Chris Combe, some rights reserved.

Tutorial Overview

This tutorial is divided into three parts; they are:

  1. Save NumPy Array to .CSV File (ASCII)
  2. Save NumPy Array to .NPY File (binary)
  3. Save NumPy Array to .NPZ File (compressed)

1. Save NumPy Array to .CSV File (ASCII)

The most common file format for storing numerical data in files is the comma-separated variable format, or CSV for short.

It is most likely that your training data and input data to your models are stored in CSV files.

It can be convenient to save data to CSV files, such as the predictions from a model.

You can save your NumPy arrays to CSV files using the savetxt() function. This function takes a filename and array as arguments and saves the array into CSV format.

You must also specify the delimiter; this is the character used to separate each variable in the file, most commonly a comma. This can be set via the “delimiter” argument.

1.1 Example of Saving a NumPy Array to CSV File

The example below demonstrates how to save a single NumPy array to CSV format.

# save numpy array as csv file
from numpy import asarray
from numpy import savetxt
# define data
data = asarray([[0, 1, 2, 3, 4, 5, 6, 7, 8, 9]])
# save to csv file
savetxt('data.csv', data, delimiter=',')

Running the example will define a NumPy array and save it to the file ‘data.csv‘.

The array has a single row of data with 10 columns. We would expect this data to be saved to a CSV file as a single row of data.

After running the example, we can inspect the contents of ‘data.csv‘.

We should see the following:

0.000000000000000000e+00,1.000000000000000000e+00,2.000000000000000000e+00,3.000000000000000000e+00,4.000000000000000000e+00,5.000000000000000000e+00,6.000000000000000000e+00,7.000000000000000000e+00,8.000000000000000000e+00,9.000000000000000000e+00

We can see that the data is correctly saved as a single row and that the floating point numbers in the array were saved with full precision.

1.2 Example of Loading a NumPy Array from CSV File

We can load this data later as a NumPy array using the loadtext() function and specify the filename and the same comma delimiter.

The complete example is listed below.

# load numpy array from csv file
from numpy import loadtxt
# load array
data = loadtxt('data.csv', delimiter=',')
# print the array
print(data)

Running the example loads the data from the CSV file and prints the contents, matching our single row with 10 columns defined in the previous example.

[0. 1. 2. 3. 4. 5. 6. 7. 8. 9.]

2. Save NumPy Array to .NPY File (binary)

Sometimes we have a lot of data in NumPy arrays that we wish to save efficiently, but which we only need to use in another Python program.

Therefore, we can save the NumPy arrays into a native binary format that is efficient to both save and load.

This is common for input data that has been prepared, such as transformed data, that will need to be used as the basis for testing a range of machine learning models in the future or running many experiments.

The .npy file format is appropriate for this use case and is referred to as simply “NumPy format“.

This can be achieved using the save() NumPy function and specifying the filename and the array that is to be saved.

2.1 Example of Saving a NumPy Array to NPY File

The example below defines our two-dimensional NumPy array and saves it to a .npy file.

# save numpy array as npy file
from numpy import asarray
from numpy import save
# define data
data = asarray([[0, 1, 2, 3, 4, 5, 6, 7, 8, 9]])
# save to npy file
save('data.npy', data)

After running the example, you will see a new file in the directory with the name ‘data.npy‘.

You cannot inspect the contents of this file directly with your text editor because it is in binary format.

2.2 Example of Loading a NumPy Array from NPY File

You can load this file as a NumPy array later using the load() function.

The complete example is listed below.

# load numpy array from npy file
from numpy import load
# load array
data = load('data.npy')
# print the array
print(data)

Running the example will load the file and print the contents, confirming that both it was loaded correctly and that the content matches what we expect in the same two-dimensional format.

[[0 1 2 3 4 5 6 7 8 9]]

3. Save NumPy Array to .NPZ File (compressed)

Sometimes, we prepare data for modeling that needs to be reused across multiple experiments, but the data is large.

This might be pre-processed NumPy arrays like a corpus of text (integers) or a collection of rescaled image data (pixels). In these cases, it is desirable to both save the data to file, but also in a compressed format.

This allows gigabytes of data to be reduced to hundreds of megabytes and allows easy transmission to other servers of cloud computing for long algorithm runs.

The .npz file format is appropriate for this case and supports a compressed version of the native NumPy file format.

The savez_compressed() NumPy function allows multiple NumPy arrays to be saved to a single compressed .npz file.

3.1 Example of Saving a NumPy Array to NPZ File

We can use this function to save our single NumPy array to a compressed file.

The complete example is listed below.

# save numpy array as npz file
from numpy import asarray
from numpy import savez_compressed
# define data
data = asarray([[0, 1, 2, 3, 4, 5, 6, 7, 8, 9]])
# save to npy file
savez_compressed('data.npz', data)

Running the example defines the array and saves it into a file in compressed numpy format with the name ‘data.npz’.

As with the .npy format, we cannot inspect the contents of the saved file with a text editor because the file format is binary.

3.2 Example of Loading a NumPy Array from NPZ File

We can load this file later using the same load() function from the previous section.

In this case, the savez_compressed() function supports saving multiple arrays to a single file. Therefore, the load() function may load multiple arrays.

The loaded arrays are returned from the load() function in a dict with the names ‘arr_0’ for the first array, ‘arr_1’ for the second, and so on.

The complete example of loading our single array is listed below.

# load numpy array from npz file
from numpy import load
# load dict of arrays
dict_data = load('data.npz')
# extract the first array
data = dict_data['arr_0']
# print the array
print(data)

Running the example loads the compressed numpy file that contains a dictionary of arrays, then extracts the first array that we saved (we only saved one), then prints the contents, confirming the values and the shape of the array matches what we saved in the first place.

[[0 1 2 3 4 5 6 7 8 9]]

Further Reading

This section provides more resources on the topic if you are looking to go deeper.

Posts

APIs

Summary

In this tutorial, you discovered how to save your NumPy arrays to file.

Specifically, you learned:

  • How to save NumPy arrays to CSV formatted files.
  • How to save NumPy arrays to NPY formatted files.
  • How to save NumPy arrays to compressed NPZ formatted files.

Do you have any questions?
Ask your questions in the comments below and I will do my best to answer.

The post How to Save a NumPy Array to File for Machine Learning appeared first on Machine Learning Mastery.
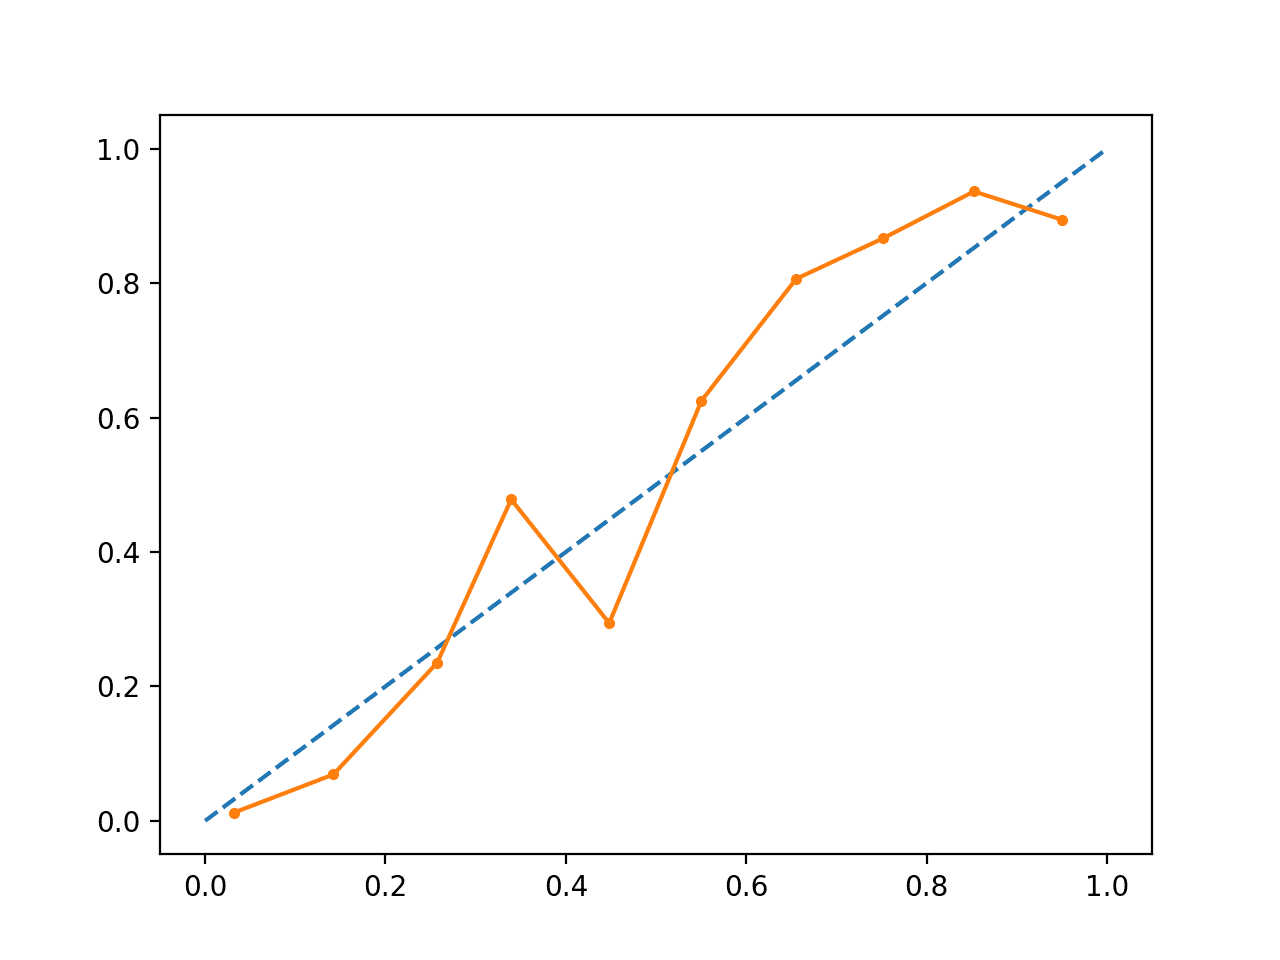
How to Connect Model Input Data With Predictions for Machine Learning

$
0
0

Fitting a model to a training dataset is so easy today with libraries like scikit-learn.

A model can be fit and evaluated on a dataset in just a few lines of code. It is so easy that it has become a problem.

The same few lines of code are repeated again and again and it may not be obvious how to actually use the model to make a prediction. Or, if a prediction is made, how to relate the predicted values to the actual input values.

I know that this is the case because I get many emails with the question:

How do I connect the predicted values with the input data?

This a common problem.

In this tutorial, you will discover how to relate the predicted values with the inputs to a machine learning model.

After completing this tutorial, you will know:

  • How to fit and evaluate the model on a training dataset.
  • How to use the fit model to make predictions one at a time and in batches.
  • How to connect the predicted values with the inputs to the model.

Let’s get started.

How to Connect Model Input Data With Predictions for Machine Learning

How to Connect Model Input Data With Predictions for Machine Learning
Photo by Ian D. Keating, some rights reserved.

Tutorial Overview

This tutorial is divided into three parts; they are:

  1. Prepare a Training Dataset
  2. How to Fit a Model on the Training Dataset
  3. How to Connect Predictions With Inputs to the Model

Prepare a Training Dataset

Let’s start off by defining a dataset that we can use with our model.

You may have your own dataset in a CSV file or in a NumPy array in memory.

In this case, we will use a simple two-class or binary classification problem with two numerical input variables.

  • Inputs: Two numerical input variables:
  • Outputs: A class label as either a 0 or 1.

We can use the make_blobs() scikit-learn function to create this dataset with 1,000 examples.

The example below creates the dataset with separate arrays for the input (X) and outputs (y).

# example of creating a test dataset
from sklearn.datasets.samples_generator import make_blobs
# create the inputs and outputs
X, y = make_blobs(n_samples=1000, centers=2, n_features=2, random_state=2)
# summarize the shape of the arrays
print(X.shape, y.shape)

Running the example creates the dataset and prints the shape of each of the arrays.

We can see that there are 1,000 rows for the 1,000 samples in the dataset. We can also see that the input data has two columns for the two input variables and that the output array is one long array of class labels for each of the rows in the input data.

(1000, 2) (1000,)

Next, we will fit a model on this training dataset.

How to Fit a Model on the Training Dataset

Now that we have a training dataset, we can fit a model on the data.

This means that we will provide all of the training data to a learning algorithm and let the learning algorithm to discover the mapping between the inputs and the output class label that minimizes the prediction error.

In this case, because it is a two-class problem, we will try the logistic regression classification algorithm.

This can be achieved using the LogisticRegression class from scikit-learn.

First, the model must be defined with any specific configuration we require. In this case, we will use the efficient ‘lbfgs‘ solver.

Next, the model is fit on the training dataset by calling the fit() function and passing in the training dataset.

Finally, we can evaluate the model by first using it to make predictions on the training dataset by calling predict() and then comparing the predictions to the expected class labels and calculating the accuracy.

The complete example is listed below.

# fit a logistic regression on the training dataset
from sklearn.linear_model import LogisticRegression
from sklearn.datasets.samples_generator import make_blobs
from sklearn.metrics import accuracy_score
# create the inputs and outputs
X, y = make_blobs(n_samples=1000, centers=2, n_features=2, random_state=2)
# define model
model = LogisticRegression(solver='lbfgs')
# fit model
model.fit(X, y)
# make predictions
yhat = model.predict(X)
# evaluate predictions
acc = accuracy_score(y, yhat)
print(acc)

Running the example fits the model on the training dataset and then prints the classification accuracy.

In this case, we can see that the model has a 100% classification accuracy on the training dataset.

1.0

Now that we know how to fit and evaluate a model on the training dataset, let’s get to the root of the question.

How do you connect inputs of the model to the outputs?

How to Connect Predictions With Inputs to the Model

A fit machine learning model takes inputs and makes a prediction.

This could be one row of data at a time; for example:

  • Input: 2.12309797 -1.41131072
  • Output: 1

This is straightforward with our model.

For example, we can make a prediction with an array input and get one output and we know that the two are directly connected.

The input must be defined as an array of numbers, specifically 1 row with 2 columns. We can achieve this by defining the example as a list of rows with a list of columns for each row; for example:

...
# define input
new_input = [[2.12309797, -1.41131072]]

We can then provide this as input to the model and make a prediction.

...
# get prediction for new input
new_output = model.predict(new_input)

Tying this together with fitting the model from the previous section, the complete example is listed below.

# make a single prediction with the model
from sklearn.linear_model import LogisticRegression
from sklearn.datasets.samples_generator import make_blobs
# create the inputs and outputs
X, y = make_blobs(n_samples=1000, centers=2, n_features=2, random_state=2)
# define model
model = LogisticRegression(solver='lbfgs')
# fit model
model.fit(X, y)
# define input
new_input = [[2.12309797, -1.41131072]]
# get prediction for new input
new_output = model.predict(new_input)
# summarize input and output
print(new_input, new_output)

Running the example defines the new input and makes a prediction, then prints both the input and the output.

We can see that in this case, the model predicts class label 1 for the inputs.

[[2.12309797, -1.41131072]] [1]

If we were using the model in our own application, this usage of the model would allow us to directly relate the inputs and outputs for each prediction made.

If we needed to replace the labels 0 and 1 with something meaningful like “spam” and “not spam“, we could do that with a simple if-statement.

So far so good.

What happens when the model is used to make multiple predictions at once?

That is, how do we relate the predictions to the inputs when multiple rows or multiple samples are provided to the model at once?

For example, we could make a prediction for each of the 1,000 examples in the training dataset as we did in the previous section when evaluating the model. In this case, the model would make 1,000 distinct predictions and return an array of 1,000 integer values. One prediction for each of the 1,000 input rows of data.

Importantly, the order of the predictions in the output array matches the order of rows provided as input to the model when making a prediction. This means that the input row at index 0 matches the prediction at index 0; the same is true for index 1, index 2, all the way to index 999.

Therefore, we can relate the inputs and outputs directly based on their index, with the knowledge that the order is preserved when making a prediction on many rows of inputs.

Let’s make this concrete with an example.

First, we can make a prediction for each row of input in the training dataset:

...
# make predictions on the entire training dataset
yhat = model.predict(X)

We can then step through the indexes and access the input and the predicted output for each.

This shows precisely how to connect the predictions with the input rows. For example, the input at row 0 and the prediction at index 0:

...
print(X[0], yhat[0])

In this case, we will just look at the first 10 rows and their predictions.

...
# connect predictions with outputs
for i in range(10):
	print(X[i], yhat[i])

Tying this together, the complete example of making a prediction for each row in the training data and connecting the predictions with the inputs is listed below.

# make a single prediction with the model
from sklearn.linear_model import LogisticRegression
from sklearn.datasets.samples_generator import make_blobs
# create the inputs and outputs
X, y = make_blobs(n_samples=1000, centers=2, n_features=2, random_state=2)
# define model
model = LogisticRegression(solver='lbfgs')
# fit model
model.fit(X, y)
# make predictions on the entire training dataset
yhat = model.predict(X)
# connect predictions with outputs
for i in range(10):
	print(X[i], yhat[i])

Running the example, the model makes 1,000 predictions for the 1,000 rows in the training dataset, then connects the inputs to the predicted values for the first 10 examples.

This provides a template that you can use and adapt for your own predictive modeling projects to connect predictions to the input rows via their row index.

[ 1.23839154 -2.8475005 ] 1
[-1.25884111 -8.57055785] 0
[ -0.86599821 -10.50446358] 0
[ 0.59831673 -1.06451727] 1
[ 2.12309797 -1.41131072] 1
[-1.53722693 -9.61845366] 0
[ 0.92194131 -0.68709327] 1
[-1.31478732 -8.78528161] 0
[ 1.57989896 -1.462412  ] 1
[ 1.36989667 -1.3964704 ] 1

Further Reading

This section provides more resources on the topic if you are looking to go deeper.

Posts

APIs

Summary

In this tutorial, you discovered how to relate the predicted values with the inputs to a machine learning model.

Specifically, you learned:

  • How to fit and evaluate the model on a training dataset.
  • How to use the fit model to make predictions one at a time and in batches.
  • How to connect the predicted values with the inputs to the model.

Do you have any questions?
Ask your questions in the comments below and I will do my best to answer.

The post How to Connect Model Input Data With Predictions for Machine Learning appeared first on Machine Learning Mastery.
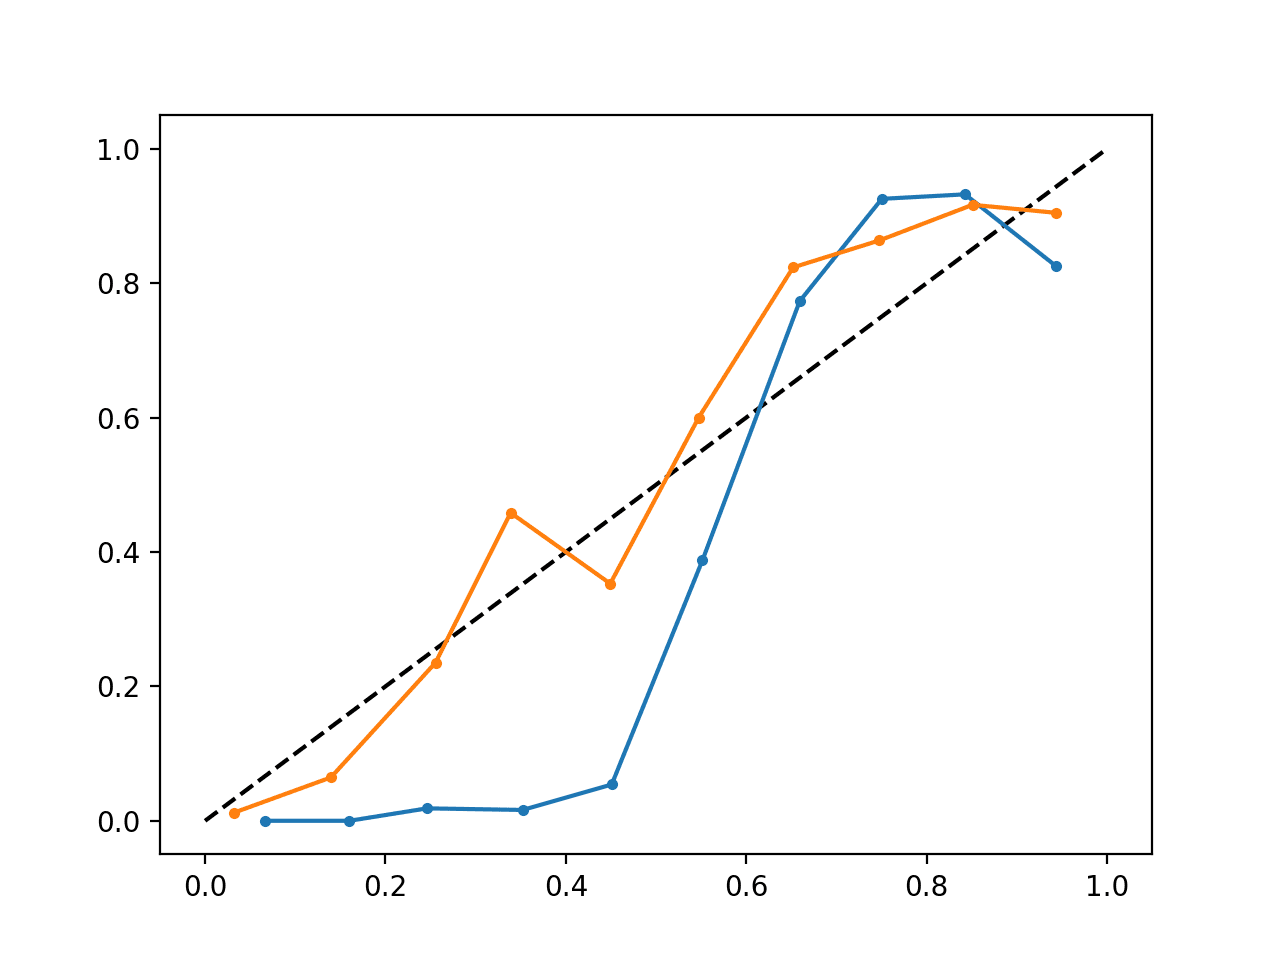
How to Save and Reuse Data Preparation Objects in Scikit-Learn

$
0
0

It is critical that any data preparation performed on a training dataset is also performed on a new dataset in the future.

This may include a test dataset when evaluating a model or new data from the domain when using a model to make predictions.

Typically, the model fit on the training dataset is saved for later use. The correct solution to preparing new data for the model in the future is to also save any data preparation objects, like data scaling methods, to file along with the model.

In this tutorial, you will discover how to save a model and data preparation object to file for later use.

After completing this tutorial, you will know:

  • The challenge of correctly preparing test data and new data for a machine learning model.
  • The solution of saving the model and data preparation objects to file for later use.
  • How to save and later load and use a machine learning model and data preparation model on new data.

Let’s get started.

How to Save and Load Models and Data Preparation in Scikit-Learn for Later Use

How to Save and Load Models and Data Preparation in Scikit-Learn for Later Use
Photo by Dennis Jarvis, some rights reserved.

Tutorial Overview

This tutorial is divided into three parts; they are:

  1. Challenging of Preparing New Data for a Model
  2. Save Data Preparation Objects
  3. How to Save and Later Use a Data Preparation Object

Challenging of Preparing New Data for a Model

Each input variable in a dataset may have different units.

For example, one variable may be in inches, another in miles, another in days, and so on.

As such, it is often important to scale data prior to fitting a model.

This is particularly important for models that use a weighted sum of the input or distance measures like logistic regression, neural networks, and k-nearest neighbors. This is because variables with larger values or ranges may dominate or wash out the effects of variables with smaller values or ranges.

Scaling techniques, such as normalization or standardization, have the effect of transforming the distribution of each input variable to be the same, such as the same minimum and maximum in the case of normalization or the same mean and standard deviation in the case of standardization.

A scaling technique must be fit, which just means it needs to calculate coefficients from data, such as the observed min and max, or the observed mean and standard deviation. These values can also be set by domain experts.

The best practice when using scaling techniques for evaluating models is to fit them on the training dataset, then apply them to the training and test datasets.

Or, when working with a final model, to fit the scaling method on the training dataset and apply the transform to the training dataset and any new dataset in the future.

It is critical that any data preparation or transformation applied to the training dataset is also applied to the test or other dataset in the future.

This is straightforward when all of the data and the model are in memory.

This is challenging when a model is saved and used later.

What is the best practice to scale data when saving a fit model for later use, such as a final model?

The Solution: Save Data Preparation Objects

The solution is to save the data preparation object to file along with the model.

For example, it is common to use the pickle framework (built-in to Python) for saving machine learning models for later use, such as saving a final model.

This same framework can be used to save the object that was used for data preparation.

Later, the model and the data preparation object can be loaded and used.

It is convenient to save the entire objects to file, such as the model object and the data preparation object. Nevertheless, experts may prefer to save just the model parameters to file, then load them later and set them into a new model object. This approach can also be used with the coefficients used for scaling the data, such as the min and max values for each variable, or the mean and standard deviation for each variable.

The choice of which approach is appropriate for your project is up to you, but I recommend saving the model and data preparation object (or objects) to file directly for later use.

To make the idea of saving the object and data transform object to file concrete, let’s look at a worked example.

How to Save and Later Use a Data Preparation Object

In this section, we will demonstrate preparing a dataset, fitting a model on the dataset, saving the model and data transform object to file, and later loading the model and transform and using them on new data.

1. Define a Dataset

First, we need a dataset.

We will use a test dataset from the scikit-learn dataset, specifically a binary classification problem with two input variables created randomly via the make_blobs() function.

The example below creates a test dataset with 100 examples, two input features, and two class labels (0 and 1). The dataset is then split into training and test sets and the min and max values of each variable are then reported.

Importantly, the random_state is set when creating the dataset and when splitting the data so that the same dataset is created and the same split of data is performed each time that the code is run.

# example of creating a test dataset and splitting it into train and test sets
from sklearn.datasets.samples_generator import make_blobs
from sklearn.model_selection import train_test_split
# prepare dataset
X, y = make_blobs(n_samples=100, centers=2, n_features=2, random_state=1)
# split data into train and test sets
X_train, X_test, y_train, y_test = train_test_split(X, y, test_size=0.33, random_state=1)
# summarize dataset
for i in range(X.shape[1]):
	print('Train', i, X_train[i].min(), X_train[i].max())
	print('Test', i, X_test[i].min(), X_test[i].max())

Running the example reports the min and max values for each variable in both the train and test datasets.

We can see that each variable has a different scale, and that the scales differ between the train and test datasets. This is a realistic scenario that we may encounter with a real dataset.

Train 0 -8.958887901793688 -1.766368900388947
Test 0 -0.5279305184970926 5.92630668526536
Train 1 -1.9657639185768914 5.234464511450407
Test 1 -2.351220657673829 4.0097363419871845

2. Scale the Dataset

Next, we can scale the dataset.

We will use the MinMaxScaler to scale each input variable to the range [0, 1]. The best practice use of this scaler is to fit it on the training dataset and then apply the transform to the training dataset, and other datasets: in this case, the test dataset.

The complete example of scaling the data and summarizing the effects is listed below.

# example of scaling the dataset
from sklearn.datasets.samples_generator import make_blobs
from sklearn.model_selection import train_test_split
from sklearn.preprocessing import MinMaxScaler
# prepare dataset
X, y = make_blobs(n_samples=100, centers=2, n_features=2, random_state=1)
# split data into train and test sets
X_train, X_test, y_train, y_test = train_test_split(X, y, test_size=0.33, random_state=1)
# define scaler
scaler = MinMaxScaler()
# fit scaler on the training dataset
scaler.fit(X_train)
# transform both datasets
X_train_scaled = scaler.transform(X_train)
X_test_scaled = scaler.transform(X_test)
# summarize dataset
for i in range(X.shape[1]):
	print('Train', i, X_train_scaled[i].min(), X_train_scaled[i].max())
	print('Test', i, X_test_scaled[i].min(), X_test_scaled[i].max())

Running the example prints the effect of the scaled data showing the min and max values for each variable in the train and test datasets.

We can see that all variables in both datasets now have values in the desired range of 0 to 1.

Train 0 0.23395851599080797 0.35842125076406284
Test 0 0.9148787986264039 0.9549870948672079
Train 1 0.7987532056890075 0.901334837494266
Test 1 0.7676220660334238 0.8063573506527247

3. Save Model and Data Scaler

Next, we can fit a model on the training dataset and save both the model and the scaler object to file.

We will use a LogisticRegression model because the problem is a simple binary classification task.

The training dataset is scaled as before, and in this case, we will assume the test dataset is currently not available. Once scaled, the dataset is used to fit a logistic regression model.

We will use the pickle framework to save the LogisticRegression model to one file, and the MinMaxScaler to another file.

The complete example is listed below.

# example of fitting a model on the scaled dataset
from sklearn.datasets.samples_generator import make_blobs
from sklearn.model_selection import train_test_split
from sklearn.preprocessing import MinMaxScaler
from sklearn.linear_model import LogisticRegression
from pickle import dump
# prepare dataset
X, y = make_blobs(n_samples=100, centers=2, n_features=2, random_state=1)
# split data into train and test sets
X_train, _, y_train, _ = train_test_split(X, y, test_size=0.33, random_state=1)
# define scaler
scaler = MinMaxScaler()
# fit scaler on the training dataset
scaler.fit(X_train)
# transform the training dataset
X_train_scaled = scaler.transform(X_train)
# define model
model = LogisticRegression(solver='lbfgs')
model.fit(X_train_scaled, y_train)
# save the model
dump(model, open('model.pkl', 'wb'))
# save the scaler
dump(scaler, open('scaler.pkl', 'wb'))

Running the example scales the data, fits the model, and saves the model and scaler to files using pickle.

You should have two files in your current working directory:

  • model.pkl
  • scaler.pkl

4. Load Model and Data Scaler

Finally, we can load the model and the scaler object and make use of them.

In this case, we will assume that the training dataset is not available, and that only new data or the test dataset is available.

We will load the model and the scaler, then use the scaler to prepare the new data and use the model to make predictions. Because it is a test dataset, we have the expected target values, so we will compare the predictions to the expected target values and calculate the accuracy of the model.

The complete example is listed below.

# load model and scaler and make predictions on new data
from sklearn.datasets.samples_generator import make_blobs
from sklearn.model_selection import train_test_split
from sklearn.metrics import accuracy_score
from pickle import load
# prepare dataset
X, y = make_blobs(n_samples=100, centers=2, n_features=2, random_state=1)
# split data into train and test sets
_, X_test, _, y_test = train_test_split(X, y, test_size=0.33, random_state=1)
# load the model
model = load(open('model.pkl', 'rb'))
# save the scaler
scaler = load(open('scaler.pkl', 'rb'))
# transform the test dataset
X_test_scaled = scaler.transform(X_test)
# make predictions on the test set
yhat = model.predict(X_test_scaled)
# evaluate accuracy
acc = accuracy_score(y_test, yhat)
print('Test Accuracy:', acc)

Running the example loads the model and scaler, then uses the scaler to prepare the test dataset correctly for the model, meeting the expectations of the model when it was trained.

The model then makes a prediction for the examples in the test set and the classification accuracy is calculated. In this case, the model achieved 100% accuracy on the test set because the test problem is trivial.

Test Accuracy: 1.0

This provides a template that you can use to save both your model and scaler object (or objects) to file on your own projects.

Further Reading

This section provides more resources on the topic if you are looking to go deeper.

Posts

APIs

Summary

In this tutorial, you discovered how to save a model and data preparation object to file for later use.

Specifically, you learned:

  • The challenge of correctly preparing test data and new data for a machine learning model.
  • The solution of saving the model and data preparation objects to file for later use.
  • How to save and later load and use a machine learning model and data preparation model on new data.

Do you have any questions?
Ask your questions in the comments below and I will do my best to answer.

The post How to Save and Reuse Data Preparation Objects in Scikit-Learn appeared first on Machine Learning Mastery.

How to Perform Feature Selection with Categorical Data

$
0
0

Feature selection is the process of identifying and selecting a subset of input features that are most relevant to the target variable.

Feature selection is often straightforward when working with real-valued data, such as using the Pearson’s correlation coefficient, but can be challenging when working with categorical data.

The two most commonly used feature selection methods for categorical input data when the target variable is also categorical (e.g. classification predictive modeling) are the chi-squared statistic and the mutual information statistic.

In this tutorial, you will discover how to perform feature selection with categorical input data.

After completing this tutorial, you will know:

  • The breast cancer predictive modeling problem with categorical inputs and binary classification target variable.
  • How to evaluate the importance of categorical features using the chi-squared and mutual information statistics.
  • How to perform feature selection for categorical data when fitting and evaluating a classification model.

Let’s get started.

How to Perform Feature Selection with Categorical Data

How to Perform Feature Selection with Categorical Data
Photo by Phil Dolby, some rights reserved.

Tutorial Overview

This tutorial is divided into three parts; they are:

  1. Breast Cancer Categorical Dataset
  2. Categorical Feature Selection
  3. Modeling With Selected Features

Breast Cancer Categorical Dataset

As the basis of this tutorial, we will use the so-called “Breast cancer” dataset that has been widely studied as a machine learning dataset since the 1980s.

The dataset classifies breast cancer patient data as either a recurrence or no recurrence of cancer. There are 286 examples and nine input variables. It is a binary classification problem.

A naive model can achieve an accuracy of 70% on this dataset. A good score is about 76% +/- 3%. We will aim for this region, but note that the models in this tutorial are not optimized; they are designed to demonstrate encoding schemes.

You can download the dataset and save the file as “breast-cancer.csv” in your current working directory.

Looking at the data, we can see that all nine input variables are categorical.

Specifically, all variables are quoted strings; some are ordinal and some are not.

'40-49','premeno','15-19','0-2','yes','3','right','left_up','no','recurrence-events'
'50-59','ge40','15-19','0-2','no','1','right','central','no','no-recurrence-events'
'50-59','ge40','35-39','0-2','no','2','left','left_low','no','recurrence-events'
'40-49','premeno','35-39','0-2','yes','3','right','left_low','yes','no-recurrence-events'
'40-49','premeno','30-34','3-5','yes','2','left','right_up','no','recurrence-events'
...

We can load this dataset into memory using the Pandas library.

...
# load the dataset as a pandas DataFrame
data = read_csv(filename, header=None)
# retrieve numpy array
dataset = data.values

Once loaded, we can split the columns into input (X) and output for modeling.

...
# split into input (X) and output (y) variables
X = dataset[:, :-1]
y = dataset[:,-1]

Finally, we can force all fields in the input data to be string, just in case Pandas tried to map some automatically to numbers (it does try).

...
# format all fields as string
X = X.astype(str)

We can tie all of this together into a helpful function that we can reuse later.

# load the dataset
def load_dataset(filename):
	# load the dataset as a pandas DataFrame
	data = read_csv(filename, header=None)
	# retrieve numpy array
	dataset = data.values
	# split into input (X) and output (y) variables
	X = dataset[:, :-1]
	y = dataset[:,-1]
	# format all fields as string
	X = X.astype(str)
	return X, y

Once loaded, we can split the data into training and test sets so that we can fit and evaluate a learning model.

We will use the train_test_split() function form scikit-learn and use 67% of the data for training and 33% for testing.

...
# load the dataset
X, y = load_dataset('breast-cancer.csv')
# split into train and test sets
X_train, X_test, y_train, y_test = train_test_split(X, y, test_size=0.33, random_state=1)

Tying all of these elements together, the complete example of loading, splitting, and summarizing the raw categorical dataset is listed below.

# load and summarize the dataset
from pandas import read_csv
from sklearn.model_selection import train_test_split

# load the dataset
def load_dataset(filename):
	# load the dataset as a pandas DataFrame
	data = read_csv(filename, header=None)
	# retrieve numpy array
	dataset = data.values
	# split into input (X) and output (y) variables
	X = dataset[:, :-1]
	y = dataset[:,-1]
	# format all fields as string
	X = X.astype(str)
	return X, y

# load the dataset
X, y = load_dataset('breast-cancer.csv')
# split into train and test sets
X_train, X_test, y_train, y_test = train_test_split(X, y, test_size=0.33, random_state=1)
# summarize
print('Train', X_train.shape, y_train.shape)
print('Test', X_test.shape, y_test.shape)

Running the example reports the size of the input and output elements of the train and test sets.

We can see that we have 191 examples for training and 95 for testing.

Train (191, 9) (191, 1)
Test (95, 9) (95, 1)

Now that we are familiar with the dataset, let’s look at how we can encode it for modeling.

We can use the OrdinalEncoder() from scikit-learn to encode each variable to integers. This is a flexible class and does allow the order of the categories to be specified as arguments if any such order is known.

Note: I will leave it as an exercise to you to update the example below to try specifying the order for those variables that have a natural ordering and see if it has an impact on model performance.

The best practice when encoding variables is to fit the encoding on the training dataset, then apply it to the train and test datasets.

The function below named prepare_inputs() takes the input data for the train and test sets and encodes it using an ordinal encoding.

# prepare input data
def prepare_inputs(X_train, X_test):
	oe = OrdinalEncoder()
	oe.fit(X_train)
	X_train_enc = oe.transform(X_train)
	X_test_enc = oe.transform(X_test)
	return X_train_enc, X_test_enc

We also need to prepare the target variable.

It is a binary classification problem, so we need to map the two class labels to 0 and 1. This is a type of ordinal encoding, and scikit-learn provides the LabelEncoder class specifically designed for this purpose. We could just as easily use the OrdinalEncoder and achieve the same result, although the LabelEncoder is designed for encoding a single variable.

The prepare_targets() function integer encodes the output data for the train and test sets.

# prepare target
def prepare_targets(y_train, y_test):
	le = LabelEncoder()
	le.fit(y_train)
	y_train_enc = le.transform(y_train)
	y_test_enc = le.transform(y_test)
	return y_train_enc, y_test_enc

We can call these functions to prepare our data.

...
# prepare input data
X_train_enc, X_test_enc = prepare_inputs(X_train, X_test)
# prepare output data
y_train_enc, y_test_enc = prepare_targets(y_train, y_test)

Tying this all together, the complete example of loading and encoding the input and output variables for the breast cancer categorical dataset is listed below.

# example of loading and preparing the breast cancer dataset
from pandas import read_csv
from sklearn.model_selection import train_test_split
from sklearn.preprocessing import LabelEncoder
from sklearn.preprocessing import OrdinalEncoder

# load the dataset
def load_dataset(filename):
	# load the dataset as a pandas DataFrame
	data = read_csv(filename, header=None)
	# retrieve numpy array
	dataset = data.values
	# split into input (X) and output (y) variables
	X = dataset[:, :-1]
	y = dataset[:,-1]
	# format all fields as string
	X = X.astype(str)
	return X, y

# prepare input data
def prepare_inputs(X_train, X_test):
	oe = OrdinalEncoder()
	oe.fit(X_train)
	X_train_enc = oe.transform(X_train)
	X_test_enc = oe.transform(X_test)
	return X_train_enc, X_test_enc

# prepare target
def prepare_targets(y_train, y_test):
	le = LabelEncoder()
	le.fit(y_train)
	y_train_enc = le.transform(y_train)
	y_test_enc = le.transform(y_test)
	return y_train_enc, y_test_enc

# load the dataset
X, y = load_dataset('breast-cancer.csv')
# split into train and test sets
X_train, X_test, y_train, y_test = train_test_split(X, y, test_size=0.33, random_state=1)
# prepare input data
X_train_enc, X_test_enc = prepare_inputs(X_train, X_test)
# prepare output data
y_train_enc, y_test_enc = prepare_targets(y_train, y_test)

Now that we have loaded and prepared the breast cancer dataset, we can explore feature selection.

Categorical Feature Selection

There are two popular feature selection techniques that can be used for categorical input data and a categorical (class) target variable.

They are:

  • Chi-Squared Statistic.
  • Mutual Information Statistic.

Let’s take a closer look at each in turn.

Chi-Squared Feature Selection

Pearson’s chi-squared statistical hypothesis test is an example of a test for independence between categorical variables.

You can learn more about this statistical test in the tutorial:

The results of this test can be used for feature selection, where those features that are independent of the target variable can be removed from the dataset.

The scikit-learn machine library provides an implementation of the chi-squared test in the chi2() function. This function can be used in a feature selection strategy, such as selecting the top k most relevant features (largest values) via the SelectKBest class.

For example, we can define the SelectKBest class to use the chi2() function and select all features, then transform the train and test sets.

...
fs = SelectKBest(score_func=chi2, k='all')
fs.fit(X_train, y_train)
X_train_fs = fs.transform(X_train)
X_test_fs = fs.transform(X_test)

We can then print the scores for each variable (largest is better), and plot the scores for each variable as a bar graph to get an idea of how many features we should select.

...
# what are scores for the features
for i in range(len(fs.scores_)):
	print('Feature %d: %f' % (i, fs.scores_[i]))
# plot the scores
pyplot.bar([i for i in range(len(fs.scores_))], fs.scores_)
pyplot.show()

Tying this together with the data preparation for the breast cancer dataset in the previous section, the complete example is listed below.

# example of chi squared feature selection for categorical data
from pandas import read_csv
from sklearn.model_selection import train_test_split
from sklearn.preprocessing import LabelEncoder
from sklearn.preprocessing import OrdinalEncoder
from sklearn.feature_selection import SelectKBest
from sklearn.feature_selection import chi2
from matplotlib import pyplot

# load the dataset
def load_dataset(filename):
	# load the dataset as a pandas DataFrame
	data = read_csv(filename, header=None)
	# retrieve numpy array
	dataset = data.values
	# split into input (X) and output (y) variables
	X = dataset[:, :-1]
	y = dataset[:,-1]
	# format all fields as string
	X = X.astype(str)
	return X, y

# prepare input data
def prepare_inputs(X_train, X_test):
	oe = OrdinalEncoder()
	oe.fit(X_train)
	X_train_enc = oe.transform(X_train)
	X_test_enc = oe.transform(X_test)
	return X_train_enc, X_test_enc

# prepare target
def prepare_targets(y_train, y_test):
	le = LabelEncoder()
	le.fit(y_train)
	y_train_enc = le.transform(y_train)
	y_test_enc = le.transform(y_test)
	return y_train_enc, y_test_enc

# feature selection
def select_features(X_train, y_train, X_test):
	fs = SelectKBest(score_func=chi2, k='all')
	fs.fit(X_train, y_train)
	X_train_fs = fs.transform(X_train)
	X_test_fs = fs.transform(X_test)
	return X_train_fs, X_test_fs, fs

# load the dataset
X, y = load_dataset('breast-cancer.csv')
# split into train and test sets
X_train, X_test, y_train, y_test = train_test_split(X, y, test_size=0.33, random_state=1)
# prepare input data
X_train_enc, X_test_enc = prepare_inputs(X_train, X_test)
# prepare output data
y_train_enc, y_test_enc = prepare_targets(y_train, y_test)
# feature selection
X_train_fs, X_test_fs, fs = select_features(X_train_enc, y_train_enc, X_test_enc)
# what are scores for the features
for i in range(len(fs.scores_)):
	print('Feature %d: %f' % (i, fs.scores_[i]))
# plot the scores
pyplot.bar([i for i in range(len(fs.scores_))], fs.scores_)
pyplot.show()

Running the example first prints the scores calculated for each input feature and the target variable.

Note: your specific results may differ. Try running the example a few times.

In this case, we can see the scores are small and it is hard to get an idea from the number alone as to which features are more relevant.

Perhaps features 3, 4, 5, and 8 are most relevant.

Feature 0: 0.472553
Feature 1: 0.029193
Feature 2: 2.137658
Feature 3: 29.381059
Feature 4: 8.222601
Feature 5: 8.100183
Feature 6: 1.273822
Feature 7: 0.950682
Feature 8: 3.699989

A bar chart of the feature importance scores for each input feature is created.

This clearly shows that feature 3 might be the most relevant (according to chi-squared) and that perhaps four of the nine input features are the most relevant.

We could set k=4 When configuring the SelectKBest to select these top four features.

Bar Chart of the Input Features (x) vs The Ch-Squared Feature Importance (y)

Bar Chart of the Input Features (x) vs The Chi-Squared Feature Importance (y)

Mutual Information Feature Selection

Mutual information from the field of information theory is the application of information gain (typically used in the construction of decision trees) to feature selection.

Mutual information is calculated between two variables and measures the reduction in uncertainty for one variable given a known value of the other variable.

You can learn more about mutual information in the following tutorial.

The scikit-learn machine learning library provides an implementation of mutual information for feature selection via the mutual_info_classif() function.

Like chi2(), it can be used in the SelectKBest feature selection strategy (and other strategies).

# feature selection
def select_features(X_train, y_train, X_test):
	fs = SelectKBest(score_func=mutual_info_classif, k='all')
	fs.fit(X_train, y_train)
	X_train_fs = fs.transform(X_train)
	X_test_fs = fs.transform(X_test)
	return X_train_fs, X_test_fs, fs

We can perform feature selection using mutual information on the breast cancer set and print and plot the scores (larger is better) as we did in the previous section.

The complete example of using mutual information for categorical feature selection is listed below.

# example of mutual information feature selection for categorical data
from pandas import read_csv
from sklearn.model_selection import train_test_split
from sklearn.preprocessing import LabelEncoder
from sklearn.preprocessing import OrdinalEncoder
from sklearn.feature_selection import SelectKBest
from sklearn.feature_selection import mutual_info_classif
from matplotlib import pyplot

# load the dataset
def load_dataset(filename):
	# load the dataset as a pandas DataFrame
	data = read_csv(filename, header=None)
	# retrieve numpy array
	dataset = data.values
	# split into input (X) and output (y) variables
	X = dataset[:, :-1]
	y = dataset[:,-1]
	# format all fields as string
	X = X.astype(str)
	return X, y

# prepare input data
def prepare_inputs(X_train, X_test):
	oe = OrdinalEncoder()
	oe.fit(X_train)
	X_train_enc = oe.transform(X_train)
	X_test_enc = oe.transform(X_test)
	return X_train_enc, X_test_enc

# prepare target
def prepare_targets(y_train, y_test):
	le = LabelEncoder()
	le.fit(y_train)
	y_train_enc = le.transform(y_train)
	y_test_enc = le.transform(y_test)
	return y_train_enc, y_test_enc

# feature selection
def select_features(X_train, y_train, X_test):
	fs = SelectKBest(score_func=mutual_info_classif, k='all')
	fs.fit(X_train, y_train)
	X_train_fs = fs.transform(X_train)
	X_test_fs = fs.transform(X_test)
	return X_train_fs, X_test_fs, fs

# load the dataset
X, y = load_dataset('breast-cancer.csv')
# split into train and test sets
X_train, X_test, y_train, y_test = train_test_split(X, y, test_size=0.33, random_state=1)
# prepare input data
X_train_enc, X_test_enc = prepare_inputs(X_train, X_test)
# prepare output data
y_train_enc, y_test_enc = prepare_targets(y_train, y_test)
# feature selection
X_train_fs, X_test_fs, fs = select_features(X_train_enc, y_train_enc, X_test_enc)
# what are scores for the features
for i in range(len(fs.scores_)):
	print('Feature %d: %f' % (i, fs.scores_[i]))
# plot the scores
pyplot.bar([i for i in range(len(fs.scores_))], fs.scores_)
pyplot.show()

Running the example first prints the scores calculated for each input feature and the target variable.

Note: your specific results may differ. Try running the example a few times.

In this case, we can see that some of the features have a very low score, suggesting that perhaps they can be removed.

Perhaps features 3, 6, 2, and 5 are most relevant.

Feature 0: 0.003588
Feature 1: 0.000000
Feature 2: 0.025934
Feature 3: 0.071461
Feature 4: 0.000000
Feature 5: 0.038973
Feature 6: 0.064759
Feature 7: 0.003068
Feature 8: 0.000000

A bar chart of the feature importance scores for each input feature is created.

Importantly, a different mixture of features is promoted.

Bar Chart of the Input Features (x) vs The Mutual Information Feature Importance (y)

Bar Chart of the Input Features (x) vs The Mutual Information Feature Importance (y)

Now that we know how to perform feature selection on categorical data for a classification predictive modeling problem, we can try developing a model using the selected features and compare the results.

Modeling With Selected Features

There are many different techniques for scoring features and selecting features based on scores; how do you know which one to use?

A robust approach is to evaluate models using different feature selection methods (and numbers of features) and select the method that results in a model with the best performance.

In this section, we will evaluate a Logistic Regression model with all features compared to a model built from features selected by chi-squared and those features selected via mutual information.

Logistic regression is a good model for testing feature selection methods as it can perform better if irrelevant features are removed from the model.

Model Built Using All Features

As a first step, we will evaluate a LogisticRegression model using all the available features.

The model is fit on the training dataset and evaluated on the test dataset.

The complete example is listed below.

# evaluation of a model using all input features
from pandas import read_csv
from sklearn.preprocessing import LabelEncoder
from sklearn.preprocessing import OrdinalEncoder
from sklearn.model_selection import train_test_split
from sklearn.linear_model import LogisticRegression
from sklearn.metrics import accuracy_score

# load the dataset
def load_dataset(filename):
	# load the dataset as a pandas DataFrame
	data = read_csv(filename, header=None)
	# retrieve numpy array
	dataset = data.values
	# split into input (X) and output (y) variables
	X = dataset[:, :-1]
	y = dataset[:,-1]
	# format all fields as string
	X = X.astype(str)
	return X, y

# prepare input data
def prepare_inputs(X_train, X_test):
	oe = OrdinalEncoder()
	oe.fit(X_train)
	X_train_enc = oe.transform(X_train)
	X_test_enc = oe.transform(X_test)
	return X_train_enc, X_test_enc

# prepare target
def prepare_targets(y_train, y_test):
	le = LabelEncoder()
	le.fit(y_train)
	y_train_enc = le.transform(y_train)
	y_test_enc = le.transform(y_test)
	return y_train_enc, y_test_enc

# load the dataset
X, y = load_dataset('breast-cancer.csv')
# split into train and test sets
X_train, X_test, y_train, y_test = train_test_split(X, y, test_size=0.33, random_state=1)
# prepare input data
X_train_enc, X_test_enc = prepare_inputs(X_train, X_test)
# prepare output data
y_train_enc, y_test_enc = prepare_targets(y_train, y_test)
# fit the model
model = LogisticRegression(solver='lbfgs')
model.fit(X_train_enc, y_train_enc)
# evaluate the model
yhat = model.predict(X_test_enc)
# evaluate predictions
accuracy = accuracy_score(y_test_enc, yhat)
print('Accuracy: %.2f' % (accuracy*100))

Running the example prints the accuracy of the model on the training dataset.

Note: your specific results may vary given the stochastic nature of the learning algorithm. Try running the example a few times.

In this case, we can see that the model achieves a classification accuracy of about 75%.

We would prefer to use a subset of features that achieves a classification accuracy that is as good or better than this.

Accuracy: 75.79

Model Built Using Chi-Squared Features

We can use the chi-squared test to score the features and select the four most relevant features.

The select_features() function below is updated to achieve this.

# feature selection
def select_features(X_train, y_train, X_test):
	fs = SelectKBest(score_func=chi2, k=4)
	fs.fit(X_train, y_train)
	X_train_fs = fs.transform(X_train)
	X_test_fs = fs.transform(X_test)
	return X_train_fs, X_test_fs

The complete example of evaluating a logistic regression model fit and evaluated on data using this feature selection method is listed below.

# evaluation of a model fit using chi squared input features
from pandas import read_csv
from sklearn.preprocessing import LabelEncoder
from sklearn.preprocessing import OrdinalEncoder
from sklearn.feature_selection import SelectKBest
from sklearn.feature_selection import chi2
from sklearn.model_selection import train_test_split
from sklearn.linear_model import LogisticRegression
from sklearn.metrics import accuracy_score

# load the dataset
def load_dataset(filename):
	# load the dataset as a pandas DataFrame
	data = read_csv(filename, header=None)
	# retrieve numpy array
	dataset = data.values
	# split into input (X) and output (y) variables
	X = dataset[:, :-1]
	y = dataset[:,-1]
	# format all fields as string
	X = X.astype(str)
	return X, y

# prepare input data
def prepare_inputs(X_train, X_test):
	oe = OrdinalEncoder()
	oe.fit(X_train)
	X_train_enc = oe.transform(X_train)
	X_test_enc = oe.transform(X_test)
	return X_train_enc, X_test_enc

# prepare target
def prepare_targets(y_train, y_test):
	le = LabelEncoder()
	le.fit(y_train)
	y_train_enc = le.transform(y_train)
	y_test_enc = le.transform(y_test)
	return y_train_enc, y_test_enc

# feature selection
def select_features(X_train, y_train, X_test):
	fs = SelectKBest(score_func=chi2, k=4)
	fs.fit(X_train, y_train)
	X_train_fs = fs.transform(X_train)
	X_test_fs = fs.transform(X_test)
	return X_train_fs, X_test_fs

# load the dataset
X, y = load_dataset('breast-cancer.csv')
# split into train and test sets
X_train, X_test, y_train, y_test = train_test_split(X, y, test_size=0.33, random_state=1)
# prepare input data
X_train_enc, X_test_enc = prepare_inputs(X_train, X_test)
# prepare output data
y_train_enc, y_test_enc = prepare_targets(y_train, y_test)
# feature selection
X_train_fs, X_test_fs = select_features(X_train_enc, y_train_enc, X_test_enc)
# fit the model
model = LogisticRegression(solver='lbfgs')
model.fit(X_train_fs, y_train_enc)
# evaluate the model
yhat = model.predict(X_test_fs)
# evaluate predictions
accuracy = accuracy_score(y_test_enc, yhat)
print('Accuracy: %.2f' % (accuracy*100))

Running the example reports the performance of the model on just four of the nine input features selected using the chi-squared statistic.

Note: your specific results may vary given the stochastic nature of the learning algorithm. Try running the example a few times.

In this case, we see that the model achieved an accuracy of about 74%, a slight drop in performance.

It is possible that some of the features removed are, in fact, adding value directly or in concert with the selected features.

At this stage, we would probably prefer to use all of the input features.

Accuracy: 74.74

Model Built Using Mutual Information Features

We can repeat the experiment and select the top four features using a mutual information statistic.

The updated version of the select_features() function to achieve this is listed below.

# feature selection
def select_features(X_train, y_train, X_test):
	fs = SelectKBest(score_func=mutual_info_classif, k=4)
	fs.fit(X_train, y_train)
	X_train_fs = fs.transform(X_train)
	X_test_fs = fs.transform(X_test)
	return X_train_fs, X_test_fs

The complete example of using mutual information for feature selection to fit a logistic regression model is listed below.

# evaluation of a model fit using mutual information input features
from pandas import read_csv
from sklearn.preprocessing import LabelEncoder
from sklearn.preprocessing import OrdinalEncoder
from sklearn.feature_selection import SelectKBest
from sklearn.feature_selection import mutual_info_classif
from sklearn.model_selection import train_test_split
from sklearn.linear_model import LogisticRegression
from sklearn.metrics import accuracy_score

# load the dataset
def load_dataset(filename):
	# load the dataset as a pandas DataFrame
	data = read_csv(filename, header=None)
	# retrieve numpy array
	dataset = data.values
	# split into input (X) and output (y) variables
	X = dataset[:, :-1]
	y = dataset[:,-1]
	# format all fields as string
	X = X.astype(str)
	return X, y

# prepare input data
def prepare_inputs(X_train, X_test):
	oe = OrdinalEncoder()
	oe.fit(X_train)
	X_train_enc = oe.transform(X_train)
	X_test_enc = oe.transform(X_test)
	return X_train_enc, X_test_enc

# prepare target
def prepare_targets(y_train, y_test):
	le = LabelEncoder()
	le.fit(y_train)
	y_train_enc = le.transform(y_train)
	y_test_enc = le.transform(y_test)
	return y_train_enc, y_test_enc

# feature selection
def select_features(X_train, y_train, X_test):
	fs = SelectKBest(score_func=mutual_info_classif, k=4)
	fs.fit(X_train, y_train)
	X_train_fs = fs.transform(X_train)
	X_test_fs = fs.transform(X_test)
	return X_train_fs, X_test_fs

# load the dataset
X, y = load_dataset('breast-cancer.csv')
# split into train and test sets
X_train, X_test, y_train, y_test = train_test_split(X, y, test_size=0.33, random_state=1)
# prepare input data
X_train_enc, X_test_enc = prepare_inputs(X_train, X_test)
# prepare output data
y_train_enc, y_test_enc = prepare_targets(y_train, y_test)
# feature selection
X_train_fs, X_test_fs = select_features(X_train_enc, y_train_enc, X_test_enc)
# fit the model
model = LogisticRegression(solver='lbfgs')
model.fit(X_train_fs, y_train_enc)
# evaluate the model
yhat = model.predict(X_test_fs)
# evaluate predictions
accuracy = accuracy_score(y_test_enc, yhat)
print('Accuracy: %.2f' % (accuracy*100))

Running the example fits the model on the four top selected features chosen using mutual information.

Note: your specific results may vary given the stochastic nature of the learning algorithm. Try running the example a few times.

In this case, we can see a small lift in classification accuracy to 76%.

To be sure that the effect is real, it would be a good idea to repeat each experiment multiple times and compare the mean performance. It may also be a good idea to explore using k-fold cross-validation instead of a simple train/test split.

Accuracy: 76.84

Further Reading

This section provides more resources on the topic if you are looking to go deeper.

Posts

API

Articles

Summary

In this tutorial, you discovered how to perform feature selection with categorical input data.

Specifically, you learned:

  • The breast cancer predictive modeling problem with categorical inputs and binary classification target variable.
  • How to evaluate the importance of categorical features using the chi-squared and mutual information statistics.
  • How to perform feature selection for categorical data when fitting and evaluating a classification model.

Do you have any questions?
Ask your questions in the comments below and I will do my best to answer.

The post How to Perform Feature Selection with Categorical Data appeared first on Machine Learning Mastery.
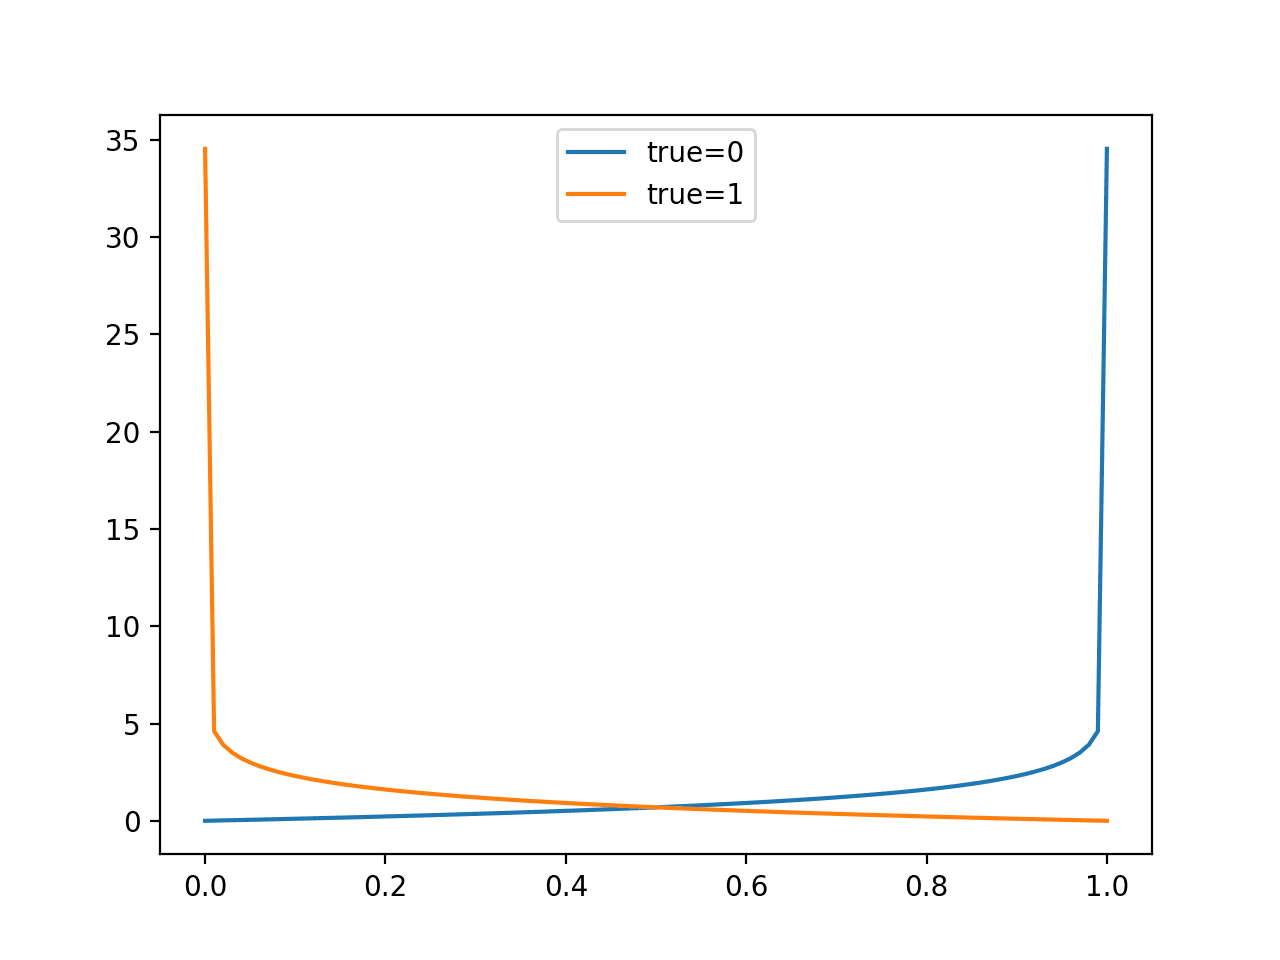
How to Choose a Feature Selection Method For Machine Learning

$
0
0

Feature selection is the process of reducing the number of input variables when developing a predictive model.

It is desirable to reduce the number of input variables to both reduce the computational cost of modeling and, in some cases, to improve the performance of the model.

Feature-based feature selection methods involve evaluating the relationship between each input variable and the target variable using statistics and selecting those input variables that have the strongest relationship with the target variable. These methods can be fast and effective, although the choice of statistical measures depends on the data type of both the input and output variables.

As such, it can be challenging for a machine learning practitioner to select an appropriate statistical measure for a dataset when performing filter-based feature selection.

In this post, you will discover how to choose statistical measures for filter-based feature selection with numerical and categorical data.

After reading this post, you will know:

  • There are two main types of feature selection techniques: wrapper and filter methods.
  • Filter-based feature selection methods use statistical measures to score the correlation or dependence between input variables that can be filtered to choose the most relevant features.
  • Statistical measures for feature selection must be carefully chosen based on the data type of the input variable and the output or response variable.

Let’s get started.

How to Develop a Probabilistic Model of Breast Cancer Patient Survival

How to Develop a Probabilistic Model of Breast Cancer Patient Survival
Photo by Tanja-Milfoil, some rights reserved.

Overview

This tutorial is divided into three parts; they are:

  1. Feature Selection Methods
  2. Statistics for Filter Feature Selection Methods
  3. Tips and Tricks for Feature Selection

Feature Selection Methods

Feature selection methods are intended to reduce the number of input variables to those that are believed to be most useful to a model in order to predict the target variable.

Some predictive modeling problems have a large number of variables that can slow the development and training of models and require a large amount of system memory. Additionally, the performance of some models can degrade when including input variables that are not relevant to the target variable.

There are two main types of feature selection algorithms: wrapper methods and filter methods.

  • Wrapper Feature Selection Methods.
  • Filter Feature Selection Methods.

Wrapper feature selection methods create many models with different subsets of input features and select those features that result in the best performing model according to a performance metric. These methods are unconcerned with the variable types, although they can be computationally expensive. RFE is a good example of a wrapper feature selection method.

Wrapper methods evaluate multiple models using procedures that add and/or remove predictors to find the optimal combination that maximizes model performance.

— Page 490, Applied Predictive Modeling, 2013.

Filter feature selection methods use statistical techniques to evaluate the relationship between each input variable and the target variable, and these scores are used as the basis to choose (filter) those input variables that will be used in the model.

Filter methods evaluate the relevance of the predictors outside of the predictive models and subsequently model only the predictors that pass some criterion.

— Page 490, Applied Predictive Modeling, 2013.

It is common to use correlation type statistical measures between input and output variables as the basis for filter feature selection. As such, the choice of statistical measures is highly dependent upon the variable data types.

Common data types include numerical (such as height) and categorical (such as a label), although each may be further subdivided such as integer and floating point for numerical variables, and boolean, ordinal, or nominal for categorical variables.

Common input variable data types:

  • Numerical Variables
    • Integer Variables.
    • Floating Point Variables.
  • Categorical Variables.
    • Boolean Variables (dichotomous).
    • Ordinal Variables.
    • Nominal Variables.

The more that is known about the data type of a variable, the easier it is to choose an appropriate statistical measure for a filter-based feature selection method.

In the next section, we will review some of the statistical measures that may be used for filter-based feature selection with different input and output variable data types.

Statistics for Filter-Based Feature Selection Methods

In this section, we will consider two broad categories of variable types: numerical and categorical; also, the two main groups of variables to consider: input and output.

Input variables are those that are provided as input to a model. In feature selection, it is this group of variables that we wish to reduce in size. Output variables are those for which a model is intended to predict, often called the response variable.

The type of response variable typically indicates the type of predictive modeling problem being performed. For example, a numerical output variable indicates a regression predictive modeling problem, and a categorical output variable indicates a classification predictive modeling problem.

  • Numerical Output: Regression predictive modeling problem.
  • Categorical Output: Classification predictive modeling problem.

The statistical measures used in filter-based feature selection are generally calculated one input variable at a time with the target variable. As such, they are referred to as univariate statistical measures. This may mean that any interaction between input variables is not considered in the filtering process.

Most of these techniques are univariate, meaning that they evaluate each predictor in isolation. In this case, the existence of correlated predictors makes it possible to select important, but redundant, predictors. The obvious consequences of this issue are that too many predictors are chosen and, as a result, collinearity problems arise.

— Page 499, Applied Predictive Modeling, 2013.

With this framework, let’s review some univariate statistical measures that can be used for filter-based feature selection.

How to Choose Feature Selection Methods For Machine Learning

How to Choose Feature Selection Methods For Machine Learning

Numerical Input, Numerical Output

This is a regression predictive modeling problem with numerical input variables.

The most common techniques are to use a correlation coefficient, such as Pearson’s for a linear correlation, or rank-based methods for a nonlinear correlation.

  • Pearson’s correlation coefficient (linear).
  • Spearman’s rank coefficient (nonlinear)

Numerical Input, Categorical Output

This is a classification predictive modeling problem with numerical input variables.

This might be the most common example of a classification problem,

Again, the most common techniques are correlation based, although in this case, they must take the categorical target into account.

  • ANOVA correlation coefficient (linear).
  • Kendall’s rank coefficient (nonlinear).

Kendall does assume that the categorical variable is ordinal.

Categorical Input, Numerical Output

This is a regression predictive modeling problem with categorical input variables.

This is a strange example of a regression problem (e.g. you would not encounter it often).

Nevertheless, you can use the same “Numerical Input, Categorical Output” methods (described above), but in reverse.

Categorical Input, Categorical Output

This is a classification predictive modeling problem with categorical input variables.

The most common correlation measure for categorical data is the chi-squared test. You can also use mutual information (information gain) from the field of information theory.

  • Chi-Squared test (contingency tables).
  • Mutual Information.

In fact, mutual information is a powerful method that may prove useful for both categorical and numerical data, e.g. it is agnostic to the data types.

Tips and Tricks for Feature Selection

This section provides some additional considerations when using filter-based feature selection.

Correlation Statistics

The scikit-learn library provides an implementation of most of the useful statistical measures.

For example:

Also, the SciPy library provides an implementation of many more statistics, such as Kendall’s tau (kendalltau) and Spearman’s rank correlation (spearmanr).

Selection Method

The scikit-learn library also provides many different filtering methods once statistics have been calculated for each input variable with the target.

Two of the more popular methods include:

I often use SelectKBest myself.

Transform Variables

Consider transforming the variables in order to access different statistical methods.

For example, you can transform a categorical variable to ordinal, even if it is not, and see if any interesting results come out.

You can also make a numerical variable discrete (e.g. bins); try categorical-based measures.

Some statistical measures assume properties of the variables, such as Pearson’s that assumes a Gaussian probability distribution to the observations and a linear relationship. You can transform the data to meet the expectations of the test and try the test regardless of the expectations and compare results.

What Is the Best Method?

There is no best feature selection method.

Just like there is no best set of input variables or best machine learning algorithm. At least not universally.

Instead, you must discover what works best for your specific problem using careful systematic experimentation.

Try a range of different models fit on different subsets of features chosen via different statistical measures and discover what works best for your specific problem.

Further Reading

This section provides more resources on the topic if you are looking to go deeper.

Posts

Articles

Summary

In this post, you discovered how to choose statistical measures for filter-based feature selection with numerical and categorical data.

Specifically, you learned:

  • There are two main types of feature selection techniques: wrapper and filter methods.
  • Filter-based feature selection methods use statistical measures to score the correlation or dependence between input variables that can be filtered to choose the most relevant features.
  • Statistical measures for feature selection must be carefully chosen based on the data type of the input variable and the output or response variable.

Do you have any questions?
Ask your questions in the comments below and I will do my best to answer.

The post How to Choose a Feature Selection Method For Machine Learning appeared first on Machine Learning Mastery.
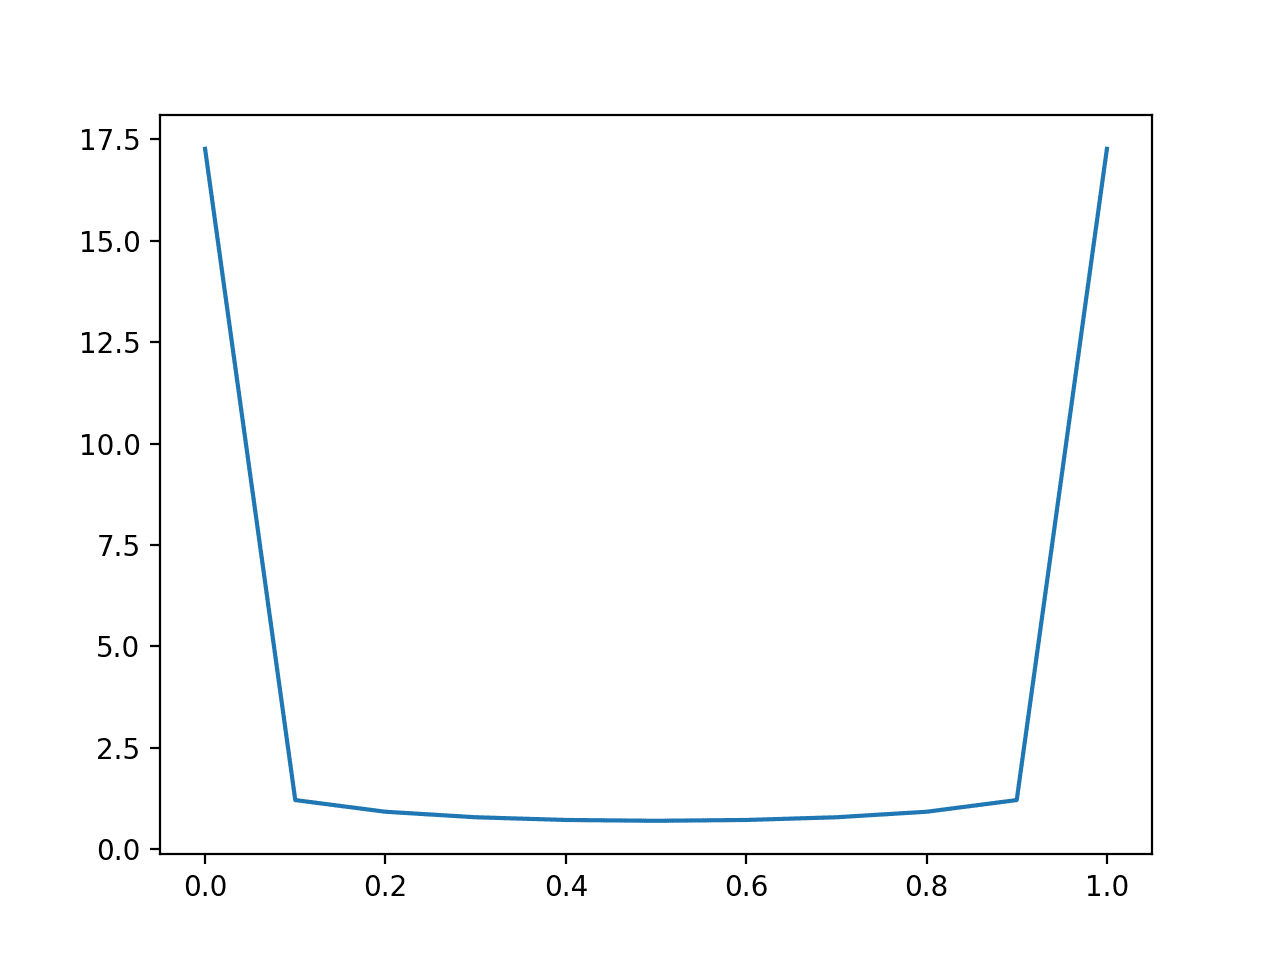
How to Use Out-of-Fold Predictions in Machine Learning

$
0
0

Machine learning algorithms are typically evaluated using resampling techniques such as k-fold cross-validation.

During the k-fold cross-validation process, predictions are made on test sets comprised of data not used to train the model. These predictions are referred to as out-of-fold predictions, a type of out-of-sample predictions.

Out-of-fold predictions play an important role in machine learning in both estimating the performance of a model when making predictions on new data in the future, so-called the generalization performance of the model, and in the development of ensemble models.

In this tutorial, you will discover a gentle introduction to out-of-fold predictions in machine learning.

After completing this tutorial, you will know:

  • Out-of-fold predictions are a type of out-of-sample predictions made on data not used to train a model.
  • Out-of-fold predictions are most commonly used to estimate the performance of a model when making predictions on unseen data.
  • Out-of-fold predictions can be used to construct an ensemble model called a stacked generalization or stacking ensemble.

Let’s get started.

How to Use Out-of-Fold Predictions in Machine Learning

How to Use Out-of-Fold Predictions in Machine Learning
Photos by Gael Varoquaux, some rights reserved.

Tutorial Overview

This tutorial is divided into three parts; they are:

  1. What Are Out-of-Fold Predictions?
  2. Out-of-Fold Predictions for Evaluation
  3. Out-of-Fold Predictions for Ensembles

What Are Out-of-Fold Predictions?

It is common to evaluate the performance of a machine learning algorithm on a dataset using a resampling technique such as k-fold cross-validation.

The k-fold cross-validation procedure involves splitting a training dataset into k groups, then using each of the k groups of examples on a test set while the remaining examples are used as a training set.

This means that k different models are trained and evaluated. The performance of the model is estimated using the predictions by the models made across all k-folds.

This procedure can be summarized as follows:

  • 1. Shuffle the dataset randomly.
  • 2. Split the dataset into k groups.
  • 3. For each unique group:
    • a. Take the group as a holdout or test data set.
    • b. Take the remaining groups as a training data set.
    • c. Fit a model on the training set and evaluate it on the test set.
    • d. Retain the evaluation score and discard the model.
  • 4. Summarize the skill of the model using the sample of model evaluation scores.

Importantly, each observation in the data sample is assigned to an individual group and stays in that group for the duration of the procedure. This means that each sample is given the opportunity to be used in the holdout set 1 time and used to train the model k-1 times.

For more on the topic of k-fold cross-validation, see the tutorial:

An out-of-fold prediction is a prediction by the model during the k-fold cross-validation procedure.

That is, out-of-fold predictions are those predictions made on the holdout datasets during the resampling procedure. If performed correctly, there will be one prediction for each example in the training dataset.

Sometimes, out-of-fold is summarized with the acronym OOF.

  • Out-of-Fold Predictions: Predictions made by models during the k-fold cross-validation procedure on the holdout examples.

The notion of out-of-fold predictions is directly related to the idea of out-of-sample predictions, as the predictions in both cases are made on examples that were not used during the training of the model and can be used to estimate the performance of the model when used to make predictions on new data.

As such, out-of-fold predictions are a type of out-of-sample prediction, although described in the context of a model evaluated using k-fold cross-validation.

  • Out-of-Sample Predictions: Predictions made by a model on data not used during the training of the model.

Out-of-sample predictions may also be referred to as holdout predictions.

There are two main uses for out-of-fold predictions; they are:

  • Estimate the performance of the model on unseen data.
  • Fit an ensemble model.

Let’s take a closer look at these two cases.

Out-of-Fold Predictions for Evaluation

The most common use for out-of-fold predictions is to estimate the performance of the model.

That is, predictions on data that were not used to train the model can be made and evaluated using a scoring metric such as error or accuracy. This metric provides an estimate of the performance of the model when used to make predictions on new data, such as when the model will be used in practice to make predictions.

Generally, predictions made on data not used to train a model provide insight into how the model will generalize to new situations. As such, scores that evaluate these predictions are referred to as the generalized performance of a machine learning model.

There are two main approaches that these predictions can use to estimate the performance of the model.

The first is to score the model on the predictions made during each fold, then calculate the average of those scores. For example, if we are evaluating a classification model, then classification accuracy can be calculated on each group of out-of-fold predictions, then the mean accuracy can be reported.

  • Approach 1: Estimate performance as the mean score estimated on each group of out-of-fold predictions.

The second approach is to consider that each example appears just once in each test set. That is, each example in the training dataset has a single prediction made during the k-fold cross-validation process. As such, we can collect all predictions and compare them to their expected outcome and calculate a score directly across the entire training dataset.

  • Approach 2: Estimate performance using the aggregate of all out-of-fold predictions.

Both are reasonable approaches and the scores that result from each procedure should be approximately equivalent.

Calculating the mean from each group of out-of-sample predictions may be the most common approach, as the variance of the estimate can also be calculated as the standard deviation or standard error.

The k resampled estimates of performance are summarized (usually with the mean and standard error) …

— Page 70, Applied Predictive Modeling, 2013.

We can demonstrate the difference between these two approaches to evaluating models using out-of-fold predictions with a small worked example.

We will use the make_blobs() scikit-learn function to create a test binary classification problem with 1,000 examples, two classes, and 100 input features.

The example below prepares a data sample and summarizes the shape of the input and output elements of the dataset.

# example of creating a test dataset
from sklearn.datasets.samples_generator import make_blobs
# create the inputs and outputs
X, y = make_blobs(n_samples=1000, centers=2, n_features=100, cluster_std=20)
# summarize the shape of the arrays
print(X.shape, y.shape)

Running the example prints the shape of the input data showing 1,000 rows of data with 100 columns or input features and the corresponding classification labels.

(1000, 100) (1000,)

Next, we can use k-fold cross-validation to evaluate a KNeighborsClassifier model.

We will use k=10 for the KFold object, the sensible default, fit a model on each training dataset, and evaluate it on each holdout fold.

Accuracy scores will be stored in a list across each model evaluation and will report the mean and standard deviation of these scores.

The complete example is listed below.

# evaluate model by averaging performance across each fold
from numpy import mean
from numpy import std
from sklearn.datasets.samples_generator import make_blobs
from sklearn.model_selection import KFold
from sklearn.neighbors import KNeighborsClassifier
from sklearn.metrics import accuracy_score
# create the inputs and outputs
X, y = make_blobs(n_samples=1000, centers=2, n_features=100, cluster_std=20)
# k-fold cross validation
scores = list()
kfold = KFold(n_splits=10, shuffle=True)
# enumerate splits
for train_ix, test_ix in kfold.split(X):
	# get data
	train_X, test_X = X[train_ix], X[test_ix]
	train_y, test_y = y[train_ix], y[test_ix]
	# fit model
	model = KNeighborsClassifier()
	model.fit(train_X, train_y)
	# evaluate model
	yhat = model.predict(test_X)
	acc = accuracy_score(test_y, yhat)
	# store score
	scores.append(acc)
	print('> ', acc)
# summarize model performance
mean_s, std_s = mean(scores), std(scores)
print('Mean: %.3f, Standard Deviation: %.3f' % (mean_s, std_s))

Running the example reports the model classification accuracy on the holdout fold for each iteration.

At the end of the run, the mean and standard deviation of the accuracy scores are reported.

Your specific results will vary given the stochastic nature of the data sample and learning algorithm. Try running the example a few times.

>  0.95
>  0.92
>  0.95
>  0.95
>  0.91
>  0.97
>  0.96
>  0.96
>  0.98
>  0.91
Mean: 0.946, Standard Deviation: 0.023

We can contrast this with the alternate approach that evaluates all predictions as a single group.

Instead of evaluating the model on each holdout fold, predictions are made and stored in a list. Then, at the end of the run, the predictions are compared to the expected values for each holdout test set and a single accuracy score is reported.

The complete example is listed below.

# evaluate model by calculating the score across all predictions
from sklearn.datasets.samples_generator import make_blobs
from sklearn.model_selection import KFold
from sklearn.neighbors import KNeighborsClassifier
from sklearn.metrics import accuracy_score
# create the inputs and outputs
X, y = make_blobs(n_samples=1000, centers=2, n_features=100, cluster_std=20)
# k-fold cross validation
data_y, data_yhat = list(), list()
kfold = KFold(n_splits=10, shuffle=True)
# enumerate splits
for train_ix, test_ix in kfold.split(X):
	# get data
	train_X, test_X = X[train_ix], X[test_ix]
	train_y, test_y = y[train_ix], y[test_ix]
	# fit model
	model = KNeighborsClassifier()
	model.fit(train_X, train_y)
	# make predictions
	yhat = model.predict(test_X)
	# store
	data_y.extend(test_y)
	data_yhat.extend(yhat)
# evaluate the model
acc = accuracy_score(data_y, data_yhat)
print('Accuracy: %.3f' % (acc))

Running the example collects all of the expected and predicted values for each holdout dataset and reports a single accuracy score at the end of the run.

Your specific results will vary given the stochastic nature of the data sample and learning algorithm. Try running the example a few times.

Accuracy: 0.930

Again, both approaches are comparable and it may be a matter of taste as to the method you use on your own predictive modeling problem.

Out-of-Fold Predictions for Ensembles

Another common use for out-of-fold predictions is to use them in the development of an ensemble model.

An ensemble is a machine learning model that combines the predictions from two or more models prepared on the same training dataset.

This is a very common procedure to use when working on a machine learning competition.

The out-of-fold predictions in aggregate provide information about how the model performs on each example in the training dataset when not used to train the model. This information can be used to train a model to correct or improve upon those predictions.

First, the k-fold cross-validation procedure is performed on each base model of interest, and all of the out-of-fold predictions are collected. Importantly, the same split of the training data into k-folds is performed for each model. Now we have one aggregated group of out-of-sample predictions for each model, e.g. predictions for each example in the training dataset.

  • Base-Models: Models evaluated using k-fold cross-validation on the training dataset and all out-of-fold predictions are retained.

Next, a second higher-order model, called a meta-model, is trained on the predictions made by the other models. This meta-model may or may not also take the input data for each example as input when making predictions. The job of this model is to learn how to best combine and correct the predictions made by the other models using their out-of-fold predictions.

  • Meta-Model: Model that takes the out-of-fold predictions made by one or more models as input and shows how to best combine and correct the predictions.

For example, we may have a two-class classification predictive modeling problem and train a decision tree and a k-nearest neighbor model as the base models. Each model predicts a 0 or 1 for each example in the training dataset via out-of-fold predictions. These predictions, along with the input data, can then form a new input to the meta-model.

  • Meta-Model Input: Input portion of a given sample concatenated with the predictions made by each base model.
  • Meta-Model Output: Output portion of a given sample.

Why use the out-of-fold predictions to train the meta-model?

We could train each base model on the entire training dataset, then make a prediction for each example in the training dataset and use the predictions as input to the meta-model. The problem is the predictions will be optimistic because the samples were used in the training of each base model. This optimistic bias means that the predictions will be better than normal, and the meta-model will likely not learn what is required to combine and correct the predictions from the base models.

By using out-of-fold predictions from the base model to train the meta-model, the meta-model can see and harness the expected behavior of each base model when operating on unseen data, as will be the case when the ensemble is used in practice to make predictions on new data.

Finally, each of the base models are trained on the entire training dataset and these final models and the meta-model can be used to make predictions on new data. The performance of this ensemble can be evaluated on a separate holdout test dataset not used during training.

This procedure can be summarized as follows:

  • 1. For each base model:
    • a. Use k-fold cross-validation and collect out-of-fold predictions.
    • b.Train meta-model on the out-of-fold predictions from all models.
    • c. Train each base model on the entire training dataset.

This procedure is called stacked generalization, or stacking for short. Because it is common to use a linear weighted sum as the meta-model, this procedure is sometimes called blending.

For more on the topic of stacking, see the tutorials:

We can make this procedure concrete with a worked example using the same dataset used in the previous section.

First, we will split the data into training and validation datasets. The training dataset will be used to fit the submodels and meta-model, and the validation dataset will be held back from training and used at the end to evaluate the meta-model and submodels.

...
# split
X, X_val, y, y_val = train_test_split(X, y, test_size=0.33)

In this example, we will use k-fold cross-validation to fit a DecisionTreeClassifier and KNeighborsClassifier model each cross-validation fold, and use the fit models to make out-of-fold predictions.

The models will make predictions of probabilities instead of class labels in an attempt to provide more useful input features for the meta-model. This is a good practice.

We will also keep track of the input data (100 features) and output data (expected label) for the out-of-fold data.

...
# collect out of sample predictions
data_x, data_y, knn_yhat, cart_yhat = list(), list(), list(), list()
kfold = KFold(n_splits=10, shuffle=True)
for train_ix, test_ix in kfold.split(X):
	# get data
	train_X, test_X = X[train_ix], X[test_ix]
	train_y, test_y = y[train_ix], y[test_ix]
	data_x.extend(test_X)
	data_y.extend(test_y)
	# fit and make predictions with cart
	model1 = DecisionTreeClassifier()
	model1.fit(train_X, train_y)
	yhat1 = model1.predict_proba(test_X)[:, 0]
	cart_yhat.extend(yhat1)
	# fit and make predictions with cart
	model2 = KNeighborsClassifier()
	model2.fit(train_X, train_y)
	yhat2 = model2.predict_proba(test_X)[:, 0]
	knn_yhat.extend(yhat2)

At the end of the run, we can then construct a dataset for a meta classifier comprised of 100 input features for the input data and the two columns of predicted probabilities from the kNN and decision tree models.

The create_meta_dataset() function below implements this, taking the out-of-fold data and predictions across the folds as input and constructs the input dataset for the meta-model.

# create a meta dataset
def create_meta_dataset(data_x, yhat1, yhat2):
	# convert to columns
	yhat1 = array(yhat1).reshape((len(yhat1), 1))
	yhat2 = array(yhat2).reshape((len(yhat2), 1))
	# stack as separate columns
	meta_X = hstack((data_x, yhat1, yhat2))
	return meta_X

We can then call this function to prepare data for the meta-model.

...
# construct meta dataset
meta_X = create_meta_dataset(data_x, knn_yhat, cart_yhat)

We can then fit each of the submodels on the entire training dataset ready for making predictions on the validation dataset.

...
# fit final submodels
model1 = DecisionTreeClassifier()
model1.fit(X, y)
model2 = KNeighborsClassifier()
model2.fit(X, y)

We can then fit the meta-model on the prepared dataset, in this case, a LogisticRegression model.

...
# construct meta classifier
meta_model = LogisticRegression(solver='liblinear')
meta_model.fit(meta_X, data_y)

Finally, we can use the meta-model to make predictions on the holdout dataset.

This requires that data first pass through the sub models, the outputs used in the construction of a dataset for the meta-model, then the meta-model is used to make a prediction. We will wrap all of this up into a function named stack_prediction() that takes the models and the data for which the prediction will be made.

# make predictions with stacked model
def stack_prediction(model1, model2, meta_model, X):
	# make predictions
	yhat1 = model1.predict_proba(X)[:, 0]
	yhat2 = model2.predict_proba(X)[:, 0]
	# create input dataset
	meta_X = create_meta_dataset(X, yhat1, yhat2)
	# predict
	return meta_model.predict(meta_X)

We can then evaluate the submodels on the holdout dataset for reference, then use the meta-model to make a prediction on the holdout dataset and evaluate it.

We expect that the meta-model would achieve as good or better performance on the holdout dataset than any single submodel. If this is not the case, alternate submodels or meta-models could be used on the problem instead.

...
# evaluate sub models on hold out dataset
acc1 = accuracy_score(y_val, model1.predict(X_val))
acc2 = accuracy_score(y_val, model2.predict(X_val))
print('Model1 Accuracy: %.3f, Model2 Accuracy: %.3f' % (acc1, acc2))
# evaluate meta model on hold out dataset
yhat = stack_prediction(model1, model2, meta_model, X_val)
acc = accuracy_score(y_val, yhat)
print('Meta Model Accuracy: %.3f' % (acc))

Tying this all together, the complete example is listed below.

# example of a stacked model for binary classification
from numpy import hstack
from numpy import array
from sklearn.datasets.samples_generator import make_blobs
from sklearn.model_selection import KFold
from sklearn.model_selection import train_test_split
from sklearn.neighbors import KNeighborsClassifier
from sklearn.tree import DecisionTreeClassifier
from sklearn.linear_model import LogisticRegression
from sklearn.metrics import accuracy_score

# create a meta dataset
def create_meta_dataset(data_x, yhat1, yhat2):
	# convert to columns
	yhat1 = array(yhat1).reshape((len(yhat1), 1))
	yhat2 = array(yhat2).reshape((len(yhat2), 1))
	# stack as separate columns
	meta_X = hstack((data_x, yhat1, yhat2))
	return meta_X

# make predictions with stacked model
def stack_prediction(model1, model2, meta_model, X):
	# make predictions
	yhat1 = model1.predict_proba(X)[:, 0]
	yhat2 = model2.predict_proba(X)[:, 0]
	# create input dataset
	meta_X = create_meta_dataset(X, yhat1, yhat2)
	# predict
	return meta_model.predict(meta_X)

# create the inputs and outputs
X, y = make_blobs(n_samples=1000, centers=2, n_features=100, cluster_std=20)
# split
X, X_val, y, y_val = train_test_split(X, y, test_size=0.33)
# collect out of sample predictions
data_x, data_y, knn_yhat, cart_yhat = list(), list(), list(), list()
kfold = KFold(n_splits=10, shuffle=True)
for train_ix, test_ix in kfold.split(X):
	# get data
	train_X, test_X = X[train_ix], X[test_ix]
	train_y, test_y = y[train_ix], y[test_ix]
	data_x.extend(test_X)
	data_y.extend(test_y)
	# fit and make predictions with cart
	model1 = DecisionTreeClassifier()
	model1.fit(train_X, train_y)
	yhat1 = model1.predict_proba(test_X)[:, 0]
	cart_yhat.extend(yhat1)
	# fit and make predictions with cart
	model2 = KNeighborsClassifier()
	model2.fit(train_X, train_y)
	yhat2 = model2.predict_proba(test_X)[:, 0]
	knn_yhat.extend(yhat2)
# construct meta dataset
meta_X = create_meta_dataset(data_x, knn_yhat, cart_yhat)
# fit final submodels
model1 = DecisionTreeClassifier()
model1.fit(X, y)
model2 = KNeighborsClassifier()
model2.fit(X, y)
# construct meta classifier
meta_model = LogisticRegression(solver='liblinear')
meta_model.fit(meta_X, data_y)
# evaluate sub models on hold out dataset
acc1 = accuracy_score(y_val, model1.predict(X_val))
acc2 = accuracy_score(y_val, model2.predict(X_val))
print('Model1 Accuracy: %.3f, Model2 Accuracy: %.3f' % (acc1, acc2))
# evaluate meta model on hold out dataset
yhat = stack_prediction(model1, model2, meta_model, X_val)
acc = accuracy_score(y_val, yhat)
print('Meta Model Accuracy: %.3f' % (acc))

Running the example first reports the accuracy of the decision tree and kNN model, then the performance of the meta-model on the holdout dataset, not seen during training.

Your specific results will vary given the stochastic nature of the data sample and learning algorithm. Try running the example a few times.

In this case, we can see that the meta-model has out-performed both submodels.

Model1 Accuracy: 0.670, Model2 Accuracy: 0.930
Meta-Model Accuracy: 0.955

It might be interesting to try an ablative study to re-run the example with just model1, just model2, and neither model 1 and model 2 as input to the meta-model to confirm that the predictions from the submodels are actually adding value to the meta-model.

Further Reading

This section provides more resources on the topic if you are looking to go deeper.

Tutorials

Books

Articles

APIs

Summary

In this tutorial, you discovered out-of-fold predictions in machine learning.

Specifically, you learned:

  • Out-of-fold predictions are a type of out-of-sample predictions made on data not used to train a model.
  • Out-of-fold predictions are most commonly used to estimate the performance of a model when making predictions on unseen data.
  • Out-of-fold predictions can be used to construct an ensemble model called a stacked generalization or stacking ensemble.

Do you have any questions?
Ask your questions in the comments below and I will do my best to answer.

The post How to Use Out-of-Fold Predictions in Machine Learning appeared first on Machine Learning Mastery.
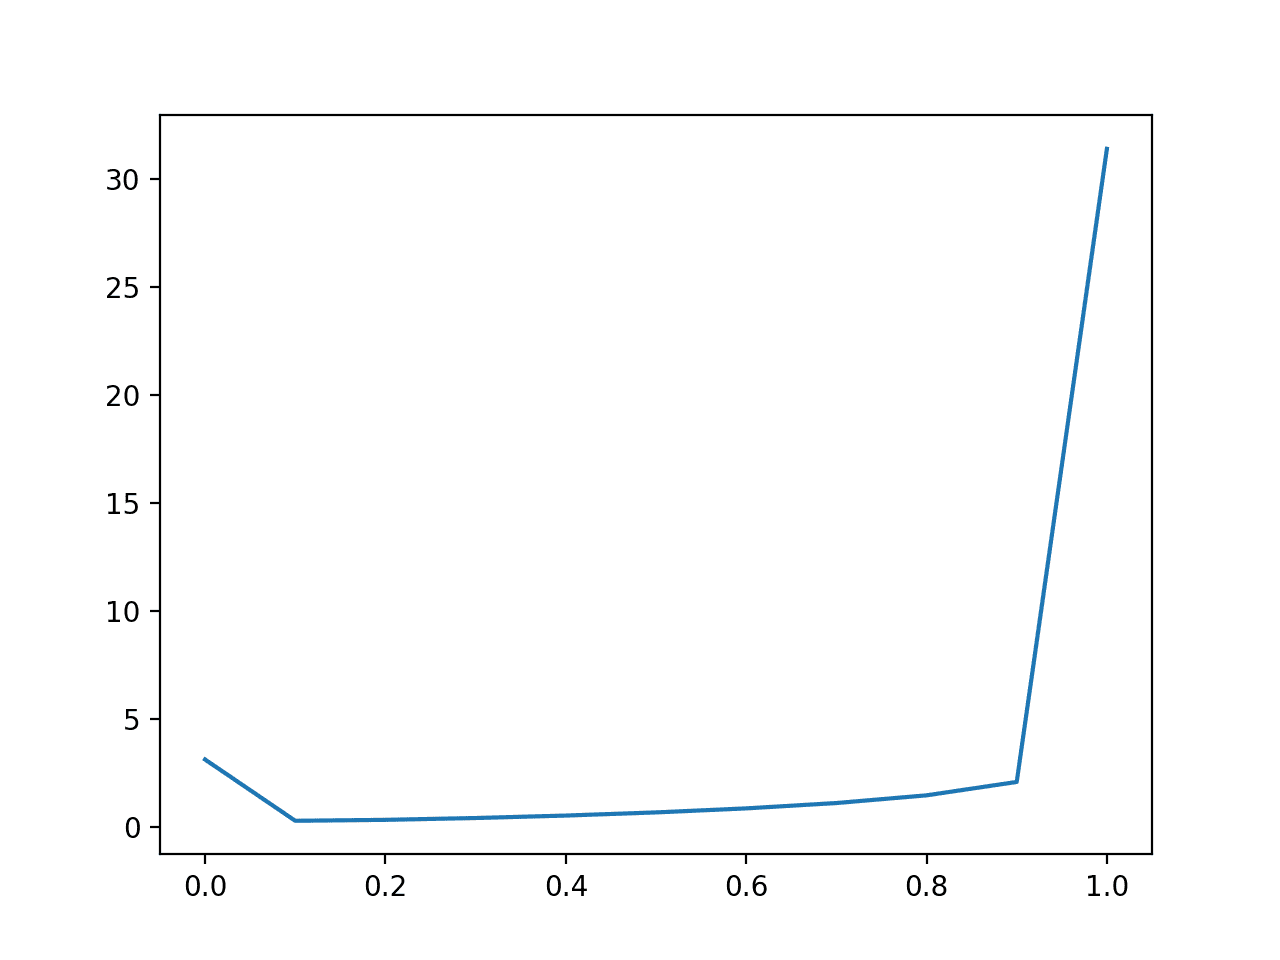

How to Develop Super Learner Ensembles in Python

$
0
0

Selecting a machine learning algorithm for a predictive modeling problem involves evaluating many different models and model configurations using k-fold cross-validation.

The super learner is an ensemble machine learning algorithm that combines all of the models and model configurations that you might investigate for a predictive modeling problem and uses them to make a prediction as-good-as or better than any single model that you may have investigated.

The super learner algorithm is an application of stacked generalization, called stacking or blending, to k-fold cross-validation where all models use the same k-fold splits of the data and a meta-model is fit on the out-of-fold predictions from each model.

In this tutorial, you will discover the super learner ensemble machine learning algorithm.

After completing this tutorial, you will know:

  • Super learner is the application of stacked generalization using out-of-fold predictions during k-fold cross-validation.
  • The super learner ensemble algorithm is straightforward to implement in Python using scikit-learn models.
  • The ML-Ensemble (mlens) library provides a convenient implementation that allows the super learner to be fit and used in just a few lines of code.

Let’s get started.

How to Develop Super Learner Ensembles in Python

How to Develop Super Learner Ensembles in Python
Photo by Mark Gunn, some rights reserved.

Tutorial Overview

This tutorial is divided into three parts; they are:

  1. What Is the Super Learner?
  2. Manually Develop a Super Learner With scikit-learn
  3. Super Learner With ML-Ensemble Library

What Is the Super Learner?

There are many hundreds of models to choose from for a predictive modeling problem; which one is best?

Then, after a model is chosen, how do you best configure it for your specific dataset?

These are open questions in applied machine learning. The best answer we have at the moment is to use empirical experimentation to test and discover what works best for your dataset.

In practice, it is generally impossible to know a priori which learner will perform best for a given prediction problem and data set.

Super Learner, 2007.

This involves selecting many different algorithms that may be appropriate for your regression or classification problem and evaluating their performance on your dataset using a resampling technique, such as k-fold cross-validation.

The algorithm that performs the best on your dataset according to k-fold cross-validation is then selected, fit on all available data, and you can then start using it to make predictions.

There is an alternative approach.

Consider that you have already fit many different algorithms on your dataset, and some algorithms have been evaluated many times with different configurations. You may have many tens or hundreds of different models of your problem. Why not use all those models instead of the best model from the group?

This is the intuition behind the so-called “super learner” ensemble algorithm.

The super learner algorithm involves first pre-defining the k-fold split of your data, then evaluating all different algorithms and algorithm configurations on the same split of the data. All out-of-fold predictions are then kept and used to train a that learns how to best combine the predictions.

The algorithms may differ in the subset of the covariates used, the basis functions, the loss functions, the searching algorithm, and the range of tuning parameters, among others.

Super Learner In Prediction, 2010.

The results of this model should be no worse than the best performing model evaluated during k-fold cross-validation and has the likelihood of performing better than any single model.

The super learner algorithm was proposed by Mark van der Laan, Eric Polley, and Alan Hubbard from Berkeley in their 2007 paper titled “Super Learner.” It was published in a biological journal, which may be sheltered from the broader machine learning community.

The super learner technique is an example of the general method called “stacked generalization,” or “stacking” for short, and is known in applied machine learning as blending, as often a linear model is used as the meta-model.

The super learner is related to the stacking algorithm introduced in neural networks context …

Super Learner In Prediction, 2010.

For more on the topic stacking, see the posts:

We can think of the “super learner” as the supplicating of stacking specifically to k-fold cross-validation.

I have sometimes seen this type of blending ensemble referred to as a cross-validation ensemble.

The procedure can be summarized as follows:

  • 1. Select a k-fold split of the training dataset.
  • 2. Select m base-models or model configurations.
  • 3. For each basemodel:
    • a. Evaluate using k-fold cross-validation.
    • b. Store all out-of-fold predictions.
    • c. Fit the model on the full training dataset and store.
  • 4. Fit a meta-model on the out-of-fold predictions.
  • 5. Evaluate the model on a holdout dataset or use model to make predictions.

The image below, taken from the original paper, summarizes this data flow.

Diagram Showing the Data Flow of the Super Learner Algorithm

Diagram Showing the Data Flow of the Super Learner Algorithm
Taken from “Super Learner.”

Let’s take a closer look at some common sticking points you may have with this procedure.

Q. What are the inputs and outputs for the meta-model?

The meta-model takes in predictions from base-models as input and predicts the target for the training dataset as output:

  • Input: Predictions from base-models.
  • Output: Prediction for training dataset.

For example, if we had 50 base-models, then one input sample would be a vector with 50 values, each value in the vector representing a prediction from one of the base-models for one sample of the training dataset.

If we had 1,000 examples (rows) in the training dataset and 50 models, then the input data for the meta-model would be 1,000 rows and 50 columns.

Q. Won’t the meta-model overfit the training data?

Probably not.

This is the trick of the super learner, and the stacked generalization procedure in general.

The input to the meta-model is the out-of-fold (out-of-sample) predictions. In aggregate, the out-of-fold predictions for a model represent the model’s skill or capability in making predictions on data not seen during training.

By training a meta-model on out-of-sample predictions of other models, the meta-model learns how to both correct the out-of-sample predictions for each model and to best combine the out-of-sample predictions from multiple models; actually, it does both tasks at the same time.

Importantly, to get an idea of the true capability of the meta-model, it must be evaluated on new out-of-sample data. That is, data not used to train the base models.

Q. Can this work for regression and classification?

Yes, it was described in the papers for regression (predicting a numerical value).

It can work just as well for classification (predicting a class label), although it is probably best to predict probabilities to give the meta-model more granularity when combining predictions.

Q. Why do we fit each base-model on the entire training dataset?

Each base-model is fit on the entire training dataset so that the model can be used later to make predictions on new examples not seen during training.

This step is strictly not required until predictions are needed by the super learner.

Q. How do we make a prediction?

To make a prediction on a new sample (row of data), first, the row of data is provided as input to each base model to generate a prediction from each model.

The predictions from the base-models are then concatenated into a vector and provided as input to the meta-model. The meta-model then makes a final prediction for the row of data.

We can summarize this procedure as follows:

  • 1. Take a sample not seen by the models during training.
  • 2. For each base-model:
    • a. Make a prediction given the sample.
    • b. Store prediction.
  • 3. Concatenate predictions from submodel into a single vector.
  • 4. Provide vector as input to the meta-model to make a final prediction.

Now that we are familiar with the super learner algorithm, let’s look at a worked example.

Manually Develop a Super Learner With scikit-learn

The Super Learner algorithm is relatively straightforward to implement on top of the scikit-learn Python machine learning library.

In this section, we will develop an example of super learning for both regression and classification that you can adapt to your own problems.

Super Learner for Regression

We will use the make_regression() test problem and generate 1,000 examples (rows) with 100 features (columns). This is a simple regression problem with a linear relationship between input and output, with added noise.

We will split the data so that 50 percent is used for training the model and 50 percent is held back to evaluate the final super model and base-models.

...
# create the inputs and outputs
X, y = make_regression(n_samples=1000, n_features=100, noise=0.5)
# split
X, X_val, y, y_val = train_test_split(X, y, test_size=0.50)
print('Train', X.shape, y.shape, 'Test', X_val.shape, y_val.shape)

Next, we will define a bunch of different regression models.

In this case, we will use nine different algorithms with modest configuration. You can use any models or model configurations you like.

The get_models() function below defines all of the models and returns them as a list.

# create a list of base-models
def get_models():
	models = list()
	models.append(LinearRegression())
	models.append(ElasticNet())
	models.append(SVR(gamma='scale'))
	models.append(DecisionTreeRegressor())
	models.append(KNeighborsRegressor())
	models.append(AdaBoostRegressor())
	models.append(BaggingRegressor(n_estimators=10))
	models.append(RandomForestRegressor(n_estimators=10))
	models.append(ExtraTreesRegressor(n_estimators=10))
	return models

Next, we will use k-fold cross-validation to make out-of-fold predictions that will be used as the dataset to train the meta-model or “super learner.”

This involves first splitting the data into k folds; we will use 10. For each fold, we will fit the model on the training part of the split and make out-of-fold predictions on the test part of the split. This is repeated for each model and all out-of-fold predictions are stored.

Each out-of-fold prediction will be a column for the meta-model input. We will collect columns from each algorithm for one fold of the data, horizontally stacking the rows. Then for all groups of columns we collect, we will vertically stack these rows into one long dataset with 500 rows and nine columns.

The get_out_of_fold_predictions() function below does this for a given test dataset and list of models; it will return the input and output dataset required to train the meta-model.

# collect out of fold predictions form k-fold cross validation
def get_out_of_fold_predictions(X, y, models):
	meta_X, meta_y = list(), list()
	# define split of data
	kfold = KFold(n_splits=10, shuffle=True)
	# enumerate splits
	for train_ix, test_ix in kfold.split(X):
		fold_yhats = list()
		# get data
		train_X, test_X = X[train_ix], X[test_ix]
		train_y, test_y = y[train_ix], y[test_ix]
		meta_y.extend(test_y)
		# fit and make predictions with each sub-model
		for model in models:
			model.fit(train_X, train_y)
			yhat = model.predict(test_X)
			# store columns
			fold_yhats.append(yhat.reshape(len(yhat),1))
		# store fold yhats as columns
		meta_X.append(hstack(fold_yhats))
	return vstack(meta_X), asarray(meta_y)

We can then call the function to get the models and the function to prepare the meta-model dataset.

...
# get models
models = get_models()
# get out of fold predictions
meta_X, meta_y = get_out_of_fold_predictions(X, y, models)
print('Meta ', meta_X.shape, meta_y.shape)

Next, we can fit all of the base-models on the entire training dataset.

# fit all base models on the training dataset
def fit_base_models(X, y, models):
	for model in models:
		model.fit(X, y)

Then, we can fit the meta-model on the prepared dataset.

In this case, we will use a linear regression model as the meta-model, as was used in the original paper.

# fit a meta model
def fit_meta_model(X, y):
	model = LinearRegression()
	model.fit(X, y)
	return model

Next, we can evaluate the base-models on the holdout dataset.

# evaluate a list of models on a dataset
def evaluate_models(X, y, models):
	for model in models:
		yhat = model.predict(X)
		mse = mean_squared_error(y, yhat)
		print('%s: RMSE %.3f' % (model.__class__.__name__, sqrt(mse)))

And, finally, use the super learner (base and meta-model) to make predictions on the holdout dataset and evaluate the performance of the approach.

The super_learner_predictions() function below will use the meta-model to make predictions for new data.

# make predictions with stacked model
def super_learner_predictions(X, models, meta_model):
	meta_X = list()
	for model in models:
		yhat = model.predict(X)
		meta_X.append(yhat.reshape(len(yhat),1))
	meta_X = hstack(meta_X)
	# predict
	return meta_model.predict(meta_X)

We can call this function and evaluate the results.

...
# evaluate meta model
yhat = super_learner_predictions(X_val, models, meta_model)
print('Super Learner: RMSE %.3f' % (sqrt(mean_squared_error(y_val, yhat))))

Tying this all together, the complete example of a super learner algorithm for regression using scikit-learn models is listed below.

# example of a super learner model for regression
from math import sqrt
from numpy import hstack
from numpy import vstack
from numpy import asarray
from sklearn.datasets.samples_generator import make_regression
from sklearn.model_selection import KFold
from sklearn.model_selection import train_test_split
from sklearn.metrics import mean_squared_error
from sklearn.linear_model import LinearRegression
from sklearn.linear_model import ElasticNet
from sklearn.neighbors import KNeighborsRegressor
from sklearn.tree import DecisionTreeRegressor
from sklearn.svm import SVR
from sklearn.ensemble import AdaBoostRegressor
from sklearn.ensemble import BaggingRegressor
from sklearn.ensemble import RandomForestRegressor
from sklearn.ensemble import ExtraTreesRegressor

# create a list of base-models
def get_models():
	models = list()
	models.append(LinearRegression())
	models.append(ElasticNet())
	models.append(SVR(gamma='scale'))
	models.append(DecisionTreeRegressor())
	models.append(KNeighborsRegressor())
	models.append(AdaBoostRegressor())
	models.append(BaggingRegressor(n_estimators=10))
	models.append(RandomForestRegressor(n_estimators=10))
	models.append(ExtraTreesRegressor(n_estimators=10))
	return models

# collect out of fold predictions form k-fold cross validation
def get_out_of_fold_predictions(X, y, models):
	meta_X, meta_y = list(), list()
	# define split of data
	kfold = KFold(n_splits=10, shuffle=True)
	# enumerate splits
	for train_ix, test_ix in kfold.split(X):
		fold_yhats = list()
		# get data
		train_X, test_X = X[train_ix], X[test_ix]
		train_y, test_y = y[train_ix], y[test_ix]
		meta_y.extend(test_y)
		# fit and make predictions with each sub-model
		for model in models:
			model.fit(train_X, train_y)
			yhat = model.predict(test_X)
			# store columns
			fold_yhats.append(yhat.reshape(len(yhat),1))
		# store fold yhats as columns
		meta_X.append(hstack(fold_yhats))
	return vstack(meta_X), asarray(meta_y)

# fit all base models on the training dataset
def fit_base_models(X, y, models):
	for model in models:
		model.fit(X, y)

# fit a meta model
def fit_meta_model(X, y):
	model = LinearRegression()
	model.fit(X, y)
	return model

# evaluate a list of models on a dataset
def evaluate_models(X, y, models):
	for model in models:
		yhat = model.predict(X)
		mse = mean_squared_error(y, yhat)
		print('%s: RMSE %.3f' % (model.__class__.__name__, sqrt(mse)))

# make predictions with stacked model
def super_learner_predictions(X, models, meta_model):
	meta_X = list()
	for model in models:
		yhat = model.predict(X)
		meta_X.append(yhat.reshape(len(yhat),1))
	meta_X = hstack(meta_X)
	# predict
	return meta_model.predict(meta_X)

# create the inputs and outputs
X, y = make_regression(n_samples=1000, n_features=100, noise=0.5)
# split
X, X_val, y, y_val = train_test_split(X, y, test_size=0.50)
print('Train', X.shape, y.shape, 'Test', X_val.shape, y_val.shape)
# get models
models = get_models()
# get out of fold predictions
meta_X, meta_y = get_out_of_fold_predictions(X, y, models)
print('Meta ', meta_X.shape, meta_y.shape)
# fit base models
fit_base_models(X, y, models)
# fit the meta model
meta_model = fit_meta_model(meta_X, meta_y)
# evaluate base models
evaluate_models(X_val, y_val, models)
# evaluate meta model
yhat = super_learner_predictions(X_val, models, meta_model)
print('Super Learner: RMSE %.3f' % (sqrt(mean_squared_error(y_val, yhat))))

Running the example first reports the shape of the prepared dataset, then the shape of the dataset for the meta-model.

Next, the performance of each base-model is reported on the holdout dataset, and finally, the performance of the super learner on the holdout dataset.

Your specific results will differ given the stochastic nature of the dataset and learning algorithms. Try running the example a few times.

In this case, we can see that the linear models perform well on the dataset and the nonlinear algorithms not so well.

We can also see that the super learner out-performed all of the base-models.

Train (500, 100) (500,) Test (500, 100) (500,)
Meta  (500, 9) (500,)

LinearRegression: RMSE 0.548
ElasticNet: RMSE 67.142
SVR: RMSE 172.717
DecisionTreeRegressor: RMSE 159.137
KNeighborsRegressor: RMSE 154.064
AdaBoostRegressor: RMSE 98.422
BaggingRegressor: RMSE 108.915
RandomForestRegressor: RMSE 115.637
ExtraTreesRegressor: RMSE 105.749

Super Learner: RMSE 0.546

You can imagine plugging in all kinds of different models into this example, including XGBoost and Keras deep learning models.

Now that we have seen how to develop a super learner for regression, let’s look at an example for classification.

Super Learner for Classification

The super learner algorithm for classification is much the same.

The inputs to the meta learner can be class labels or class probabilities, with the latter more likely to be useful given the increased granularity or uncertainty captured in the predictions.

In this problem, we will use the make_blobs() test classification problem and use 1,000 examples with 100 input variables and two class labels.

...
# create the inputs and outputs
X, y = make_blobs(n_samples=1000, centers=2, n_features=100, cluster_std=20)
# split
X, X_val, y, y_val = train_test_split(X, y, test_size=0.50)
print('Train', X.shape, y.shape, 'Test', X_val.shape, y_val.shape)

Next, we can change the get_models() function to define a suite of linear and nonlinear classification algorithms.

# create a list of base-models
def get_models():
	models = list()
	models.append(LogisticRegression(solver='liblinear'))
	models.append(DecisionTreeClassifier())
	models.append(SVC(gamma='scale', probability=True))
	models.append(GaussianNB())
	models.append(KNeighborsClassifier())
	models.append(AdaBoostClassifier())
	models.append(BaggingClassifier(n_estimators=10))
	models.append(RandomForestClassifier(n_estimators=10))
	models.append(ExtraTreesClassifier(n_estimators=10))
	return models

Next, we can change the get_out_of_fold_predictions() function to predict probabilities by a call to the predict_proba() function.

# collect out of fold predictions form k-fold cross validation
def get_out_of_fold_predictions(X, y, models):
	meta_X, meta_y = list(), list()
	# define split of data
	kfold = KFold(n_splits=10, shuffle=True)
	# enumerate splits
	for train_ix, test_ix in kfold.split(X):
		fold_yhats = list()
		# get data
		train_X, test_X = X[train_ix], X[test_ix]
		train_y, test_y = y[train_ix], y[test_ix]
		meta_y.extend(test_y)
		# fit and make predictions with each sub-model
		for model in models:
			model.fit(train_X, train_y)
			yhat = model.predict_proba(test_X)
			# store columns
			fold_yhats.append(yhat)
		# store fold yhats as columns
		meta_X.append(hstack(fold_yhats))
	return vstack(meta_X), asarray(meta_y)

A Logistic Regression algorithm instead of a Linear Regression algorithm will be used as the meta-algorithm in the fit_meta_model() function.

# fit a meta model
def fit_meta_model(X, y):
	model = LogisticRegression(solver='liblinear')
	model.fit(X, y)
	return model

And classification accuracy will be used to report model performance.

The complete example of the super learner algorithm for classification using scikit-learn models is listed below.

# example of a super learner model for binary classification
from numpy import hstack
from numpy import vstack
from numpy import asarray
from sklearn.datasets.samples_generator import make_blobs
from sklearn.model_selection import KFold
from sklearn.model_selection import train_test_split
from sklearn.metrics import accuracy_score
from sklearn.neighbors import KNeighborsClassifier
from sklearn.linear_model import LogisticRegression
from sklearn.tree import DecisionTreeClassifier
from sklearn.svm import SVC
from sklearn.naive_bayes import GaussianNB
from sklearn.ensemble import AdaBoostClassifier
from sklearn.ensemble import BaggingClassifier
from sklearn.ensemble import RandomForestClassifier
from sklearn.ensemble import ExtraTreesClassifier

# create a list of base-models
def get_models():
	models = list()
	models.append(LogisticRegression(solver='liblinear'))
	models.append(DecisionTreeClassifier())
	models.append(SVC(gamma='scale', probability=True))
	models.append(GaussianNB())
	models.append(KNeighborsClassifier())
	models.append(AdaBoostClassifier())
	models.append(BaggingClassifier(n_estimators=10))
	models.append(RandomForestClassifier(n_estimators=10))
	models.append(ExtraTreesClassifier(n_estimators=10))
	return models

# collect out of fold predictions form k-fold cross validation
def get_out_of_fold_predictions(X, y, models):
	meta_X, meta_y = list(), list()
	# define split of data
	kfold = KFold(n_splits=10, shuffle=True)
	# enumerate splits
	for train_ix, test_ix in kfold.split(X):
		fold_yhats = list()
		# get data
		train_X, test_X = X[train_ix], X[test_ix]
		train_y, test_y = y[train_ix], y[test_ix]
		meta_y.extend(test_y)
		# fit and make predictions with each sub-model
		for model in models:
			model.fit(train_X, train_y)
			yhat = model.predict_proba(test_X)
			# store columns
			fold_yhats.append(yhat)
		# store fold yhats as columns
		meta_X.append(hstack(fold_yhats))
	return vstack(meta_X), asarray(meta_y)

# fit all base models on the training dataset
def fit_base_models(X, y, models):
	for model in models:
		model.fit(X, y)

# fit a meta model
def fit_meta_model(X, y):
	model = LogisticRegression(solver='liblinear')
	model.fit(X, y)
	return model

# evaluate a list of models on a dataset
def evaluate_models(X, y, models):
	for model in models:
		yhat = model.predict(X)
		acc = accuracy_score(y, yhat)
		print('%s: %.3f' % (model.__class__.__name__, acc*100))

# make predictions with stacked model
def super_learner_predictions(X, models, meta_model):
	meta_X = list()
	for model in models:
		yhat = model.predict_proba(X)
		meta_X.append(yhat)
	meta_X = hstack(meta_X)
	# predict
	return meta_model.predict(meta_X)

# create the inputs and outputs
X, y = make_blobs(n_samples=1000, centers=2, n_features=100, cluster_std=20)
# split
X, X_val, y, y_val = train_test_split(X, y, test_size=0.50)
print('Train', X.shape, y.shape, 'Test', X_val.shape, y_val.shape)
# get models
models = get_models()
# get out of fold predictions
meta_X, meta_y = get_out_of_fold_predictions(X, y, models)
print('Meta ', meta_X.shape, meta_y.shape)
# fit base models
fit_base_models(X, y, models)
# fit the meta model
meta_model = fit_meta_model(meta_X, meta_y)
# evaluate base models
evaluate_models(X_val, y_val, models)
# evaluate meta model
yhat = super_learner_predictions(X_val, models, meta_model)
print('Super Learner: %.3f' % (accuracy_score(y_val, yhat) * 100))

As before, the shape of the dataset and the prepared meta dataset is reported, followed by the performance of the base-models on the holdout dataset and finally the super model itself on the holdout dataset.

Your specific results will differ given the stochastic nature of the dataset and learning algorithms. Try running the example a few times.

In this case, we can see that the super learner has slightly better performance than the base learner algorithms.

Train (500, 100) (500,) Test (500, 100) (500,)
Meta (500, 18) (500,)

LogisticRegression: 96.600
DecisionTreeClassifier: 74.400
SVC: 97.400
GaussianNB: 97.800
KNeighborsClassifier: 95.400
AdaBoostClassifier: 93.200
BaggingClassifier: 84.400
RandomForestClassifier: 82.800
ExtraTreesClassifier: 82.600

Super Learner: 98.000

Super Learner With ML-Ensemble Library

Implementing the super learner manually is a good exercise but is not ideal.

We may introduce bugs in the implementation and the example as listed does not make use of multiple cores to speed up the execution.

Thankfully, Sebastian Flennerhag provides an efficient and tested implementation of the Super Learner algorithm and other ensemble algorithms in his ML-Ensemble (mlens) Python library. It is specifically designed to work with scikit-learn models.

First, the library must be installed, which can be achieved via pip, as follows:

sudo pip install mlens

Next, a SuperLearner class can be defined, models added via a call to the add() function, the meta learner added via a call to the add_meta() function, then the model used like any other scikit-learn model.

...
# configure model
ensemble = SuperLearner(...)
# add list of base learners
ensemble.add(...)
# add meta learner
ensemble.add_meta(...)
# use model ...

We can use this class on the regression and classification problems from the previous section.

Super Learner for Regression With the ML-Ensemble Library

First, we can define a function to calculate RMSE for our problem that the super learner can use to evaluate base-models.

# cost function for base models
def rmse(yreal, yhat):
	return sqrt(mean_squared_error(yreal, yhat))

Next, we can configure the SuperLearner with 10-fold cross-validation, our evaluation function, and the use of the entire training dataset when preparing out-of-fold predictions to use as input for the meta-model.

The get_super_learner() function below implements this.

# create the super learner
def get_super_learner(X):
	ensemble = SuperLearner(scorer=rmse, folds=10, shuffle=True, sample_size=len(X))
	# add base models
	models = get_models()
	ensemble.add(models)
	# add the meta model
	ensemble.add_meta(LinearRegression())
	return ensemble

We can then fit the model on the training dataset.

...
# fit the super learner
ensemble.fit(X, y)

Once fit, we can get a nice report of the performance of each of the base-models on the training dataset using k-fold cross-validation by accessing the “data” attribute on the model.

...
# summarize base learners
print(ensemble.data)

And that’s all there is to it.

Tying this together, the complete example of evaluating a super learner using the mlens library for regression is listed below.

# example of a super learner for regression using the mlens library
from math import sqrt
from sklearn.datasets.samples_generator import make_regression
from sklearn.model_selection import train_test_split
from sklearn.metrics import mean_squared_error
from sklearn.linear_model import LinearRegression
from sklearn.linear_model import ElasticNet
from sklearn.neighbors import KNeighborsRegressor
from sklearn.tree import DecisionTreeRegressor
from sklearn.svm import SVR
from sklearn.ensemble import AdaBoostRegressor
from sklearn.ensemble import BaggingRegressor
from sklearn.ensemble import RandomForestRegressor
from sklearn.ensemble import ExtraTreesRegressor
from mlens.ensemble import SuperLearner

# create a list of base-models
def get_models():
	models = list()
	models.append(LinearRegression())
	models.append(ElasticNet())
	models.append(SVR(gamma='scale'))
	models.append(DecisionTreeRegressor())
	models.append(KNeighborsRegressor())
	models.append(AdaBoostRegressor())
	models.append(BaggingRegressor(n_estimators=10))
	models.append(RandomForestRegressor(n_estimators=10))
	models.append(ExtraTreesRegressor(n_estimators=10))
	return models

# cost function for base models
def rmse(yreal, yhat):
	return sqrt(mean_squared_error(yreal, yhat))

# create the super learner
def get_super_learner(X):
	ensemble = SuperLearner(scorer=rmse, folds=10, shuffle=True, sample_size=len(X))
	# add base models
	models = get_models()
	ensemble.add(models)
	# add the meta model
	ensemble.add_meta(LinearRegression())
	return ensemble

# create the inputs and outputs
X, y = make_regression(n_samples=1000, n_features=100, noise=0.5)
# split
X, X_val, y, y_val = train_test_split(X, y, test_size=0.50)
print('Train', X.shape, y.shape, 'Test', X_val.shape, y_val.shape)
# create the super learner
ensemble = get_super_learner(X)
# fit the super learner
ensemble.fit(X, y)
# summarize base learners
print(ensemble.data)
# evaluate meta model
yhat = ensemble.predict(X_val)
print('Super Learner: RMSE %.3f' % (rmse(y_val, yhat)))

Running the example first reports the RMSE for (score-m) for each base-model, then reports the RMSE for the super learner itself.

Fitting and evaluating is very fast given the use of multi-threading in the backend allowing all cores of your machine to be used.

Your specific results will differ given the stochastic nature of the dataset and learning algorithms. Try running the example a few times.

In this case, we can see that the super learner performs well.

Note that we cannot compare the base learner scores in the table to the super learner as the base learners were evaluated on the training dataset only, not the holdout dataset.

[MLENS] backend: threading
Train (500, 100) (500,) Test (500, 100) (500,)
                                  score-m  score-s  ft-m  ft-s  pt-m  pt-s
layer-1  adaboostregressor          86.67     9.35  0.56  0.02  0.03  0.01
layer-1  baggingregressor           94.46    11.70  0.22  0.01  0.01  0.00
layer-1  decisiontreeregressor     137.99    12.29  0.03  0.00  0.00  0.00
layer-1  elasticnet                 62.79     5.51  0.01  0.00  0.00  0.00
layer-1  extratreesregressor        84.18     7.87  0.15  0.03  0.00  0.01
layer-1  kneighborsregressor       152.42     9.85  0.00  0.00  0.00  0.00
layer-1  linearregression            0.59     0.07  0.02  0.01  0.00  0.00
layer-1  randomforestregressor      93.19    10.10  0.20  0.02  0.00  0.00
layer-1  svr                       162.56    12.48  0.03  0.00  0.00  0.00

Super Learner: RMSE 0.571

Super Learner for Classification With the ML-Ensemble Library

The ML-Ensemble is also very easy to use for classification problems, following the same general pattern.

In this case, we will use our list of classifier models and a logistic regression model as the meta-model.

The complete example of fitting and evaluating a super learner model for a test classification problem with the mlens library is listed below.

# example of a super learner using the mlens library
from sklearn.datasets.samples_generator import make_blobs
from sklearn.model_selection import train_test_split
from sklearn.metrics import accuracy_score
from sklearn.neighbors import KNeighborsClassifier
from sklearn.linear_model import LogisticRegression
from sklearn.tree import DecisionTreeClassifier
from sklearn.svm import SVC
from sklearn.naive_bayes import GaussianNB
from sklearn.ensemble import AdaBoostClassifier
from sklearn.ensemble import BaggingClassifier
from sklearn.ensemble import RandomForestClassifier
from sklearn.ensemble import ExtraTreesClassifier
from mlens.ensemble import SuperLearner

# create a list of base-models
def get_models():
	models = list()
	models.append(LogisticRegression(solver='liblinear'))
	models.append(DecisionTreeClassifier())
	models.append(SVC(gamma='scale', probability=True))
	models.append(GaussianNB())
	models.append(KNeighborsClassifier())
	models.append(AdaBoostClassifier())
	models.append(BaggingClassifier(n_estimators=10))
	models.append(RandomForestClassifier(n_estimators=10))
	models.append(ExtraTreesClassifier(n_estimators=10))
	return models

# create the super learner
def get_super_learner(X):
	ensemble = SuperLearner(scorer=accuracy_score, folds=10, shuffle=True, sample_size=len(X))
	# add base models
	models = get_models()
	ensemble.add(models)
	# add the meta model
	ensemble.add_meta(LogisticRegression(solver='lbfgs'))
	return ensemble

# create the inputs and outputs
X, y = make_blobs(n_samples=1000, centers=2, n_features=100, cluster_std=20)
# split
X, X_val, y, y_val = train_test_split(X, y, test_size=0.50)
print('Train', X.shape, y.shape, 'Test', X_val.shape, y_val.shape)
# create the super learner
ensemble = get_super_learner(X)
# fit the super learner
ensemble.fit(X, y)
# summarize base learners
print(ensemble.data)
# make predictions on hold out set
yhat = ensemble.predict(X_val)
print('Super Learner: %.3f' % (accuracy_score(y_val, yhat) * 100))

Running the example summarizes the shape of the dataset, the performance of the base-models, and finally the performance of the super learner on the holdout dataset.

Your specific results will differ given the stochastic nature of the dataset and learning algorithms. Try running the example a few times.

Again, we can see that the super learner performs well on this test problem, and more importantly, is fit and evaluated very quickly as compared to the manual example in the previous section.

[MLENS] backend: threading
Train (500, 100) (500,) Test (500, 100) (500,)
                                   score-m  score-s  ft-m  ft-s  pt-m  pt-s
layer-1  adaboostclassifier           0.90     0.04  0.51  0.05  0.04  0.01
layer-1  baggingclassifier            0.83     0.06  0.21  0.01  0.01  0.00
layer-1  decisiontreeclassifier       0.68     0.07  0.03  0.00  0.00  0.00
layer-1  extratreesclassifier         0.80     0.05  0.09  0.01  0.00  0.00
layer-1  gaussiannb                   0.96     0.04  0.01  0.00  0.00  0.00
layer-1  kneighborsclassifier         0.90     0.03  0.00  0.00  0.03  0.01
layer-1  logisticregression           0.93     0.03  0.01  0.00  0.00  0.00
layer-1  randomforestclassifier       0.81     0.06  0.09  0.03  0.00  0.00
layer-1  svc                          0.96     0.03  0.10  0.01  0.00  0.00

Super Learner: 97.400

Further Reading

This section provides more resources on the topic if you are looking to go deeper.

Tutorials

Books

Papers

R Software

Python Software

Summary

In this tutorial, you discovered the super learner ensemble machine learning algorithm.

Specifically, you learned:

  • Super learner is the application of stacked generalization using out-of-fold predictions during k-fold cross-validation.
  • The super learner ensemble algorithm is straightforward to implement in Python using scikit-learn models.
  • The ML-Ensemble (mlens) library provides a convenient implementation that allows the super learner to be fit and used in just a few lines of code.

Do you have any questions?
Ask your questions in the comments below and I will do my best to answer.

The post How to Develop Super Learner Ensembles in Python appeared first on Machine Learning Mastery.
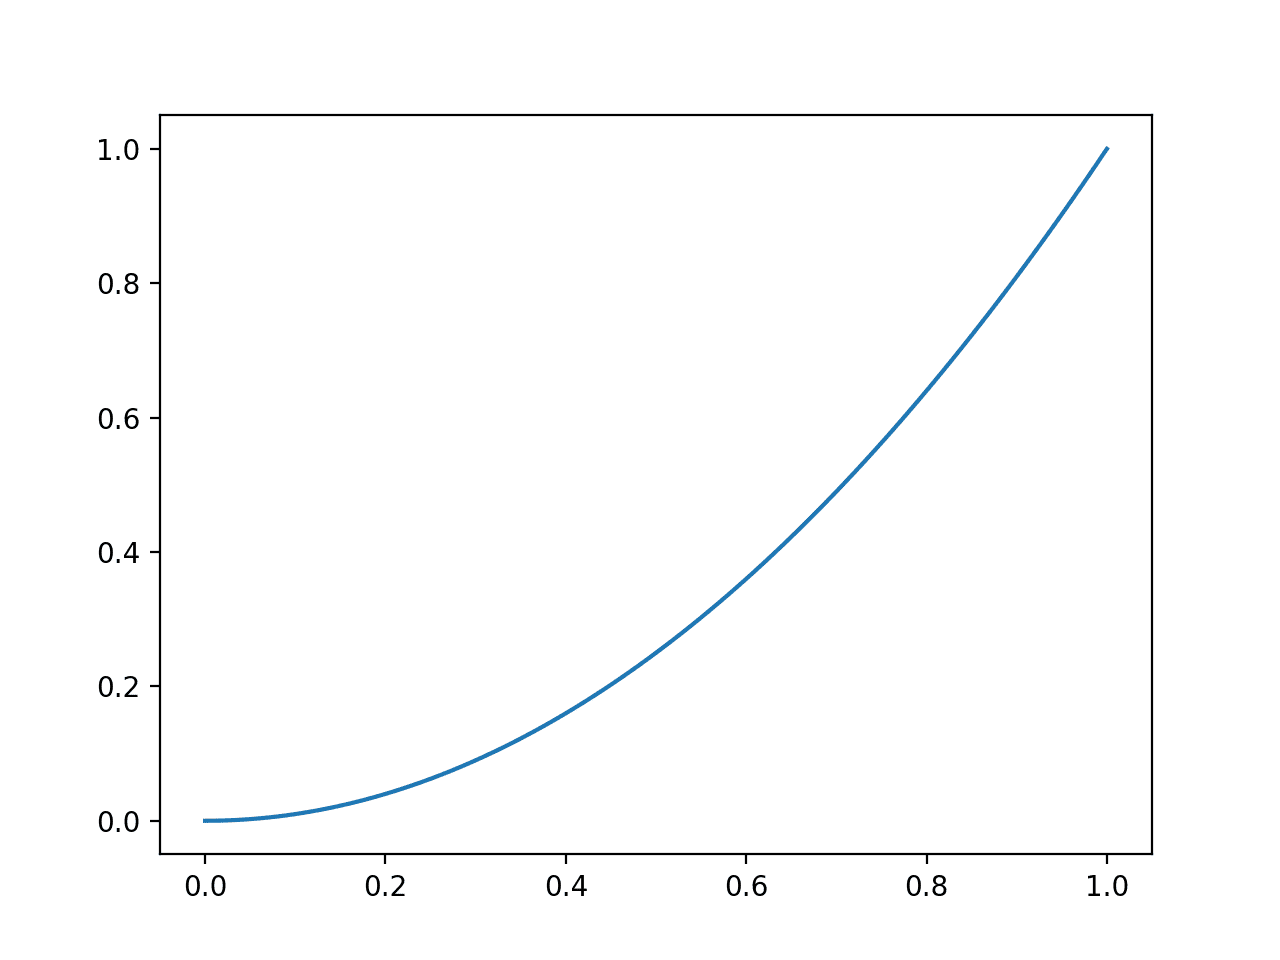
Tune Hyperparameters for Classification Machine Learning Algorithms

$
0
0

Machine learning algorithms have hyperparameters that allow you to tailor the behavior of the algorithm to your specific dataset.

Hyperparameters are different from parameters, which are the internal coefficients or weights for a model found by the learning algorithm. Unlike parameters, hyperparameters are specified by the practitioner when configuring the model.

Typically, it is challenging to know what values to use for the hyperparameters of a given algorithm on a given dataset, therefore it is common to use random or grid search strategies for different hyperparameter values.

The more hyperparameters of an algorithm that you need to tune, the slower the tuning process. Therefore, it is desirable to select a minimum subset of model hyperparameters to search or tune.

Not all model hyperparameters are equally important. Some hyperparameters have an outsized effect on the behavior, and in turn, the performance of a machine learning algorithm.

As a machine learning practitioner, you must know which hyperparameters to focus on to get a good result quickly.

In this tutorial, you will discover those hyperparameters that are most important for some of the top machine learning algorithms.

Let’s get started.

Hyperparameters for Classification Machine Learning Algorithms

Hyperparameters for Classification Machine Learning Algorithms
Photo by shuttermonkey, some rights reserved.

Classification Algorithms Overview

We will take a closer look at the important hyperparameters of the top machine learning algorithms that you may use for classification.

We will look at the hyperparameters you need to focus on and suggested values to try when tuning the model on your dataset.

The suggestions are based both on advice from textbooks on the algorithms and practical advice suggested by practitioners, as well as a little of my own experience.

The seven classification algorithms we will look at are as follows:

  1. Logistic Regression
  2. Ridge Classifier
  3. K-Nearest Neighbors (KNN)
  4. Support Vector Machine (SVM)
  5. Bagged Decision Trees (Bagging)
  6. Random Forest
  7. Stochastic Gradient Boosting

We will consider these algorithms in the context of their scikit-learn implementation (Python); nevertheless, you can use the same hyperparameter suggestions with other platforms, such as Weka and R.

A small grid searching example is also given for each algorithm that you can use as a starting point for your own classification predictive modeling project.

Note: if you have had success with different hyperparameter values or even different hyperparameters than those suggested in this tutorial, let me know in the comments below. I’d love to hear about it.

Let’s dive in.

Logistic Regression

Logistic regression does not really have any critical hyperparameters to tune.

Sometimes, you can see useful differences in performance or convergence with different solvers (solver).

  • solver in [‘newton-cg’, ‘lbfgs’, ‘liblinear’, ‘sag’, ‘saga’]

Regularization (penalty) can sometimes be helpful.

  • penalty in [‘none’, ‘l1’, ‘l2’, ‘elasticnet’]

Note: not all solvers support all regularization terms.

The C parameter controls the penality strength, which can also be effective.

  • C in [100, 10, 1.0, 0.1, 0.01]

For the full list of hyperparameters, see:

The example below demonstrates grid searching the key hyperparameters for LogisticRegression on a synthetic binary classification dataset.

Some combinations were omitted to cut back on the warnings/errors.

# example of grid searching key hyperparametres for logistic regression
from sklearn.datasets.samples_generator import make_blobs
from sklearn.model_selection import RepeatedStratifiedKFold
from sklearn.model_selection import GridSearchCV
from sklearn.linear_model import LogisticRegression
# define dataset
X, y = make_blobs(n_samples=1000, centers=2, n_features=100, cluster_std=20)
# define models and parameters
model = LogisticRegression()
solvers = ['newton-cg', 'lbfgs', 'liblinear']
penalty = ['l2']
c_values = [100, 10, 1.0, 0.1, 0.01]
# define grid search
grid = dict(solver=solvers,penalty=penalty,C=c_values)
cv = RepeatedStratifiedKFold(n_splits=10, n_repeats=3, random_state=1)
grid_search = GridSearchCV(estimator=model, param_grid=grid, n_jobs=-1, cv=cv, scoring='accuracy',error_score=0)
grid_result = grid_search.fit(X, y)
# summarize results
print("Best: %f using %s" % (grid_result.best_score_, grid_result.best_params_))
means = grid_result.cv_results_['mean_test_score']
stds = grid_result.cv_results_['std_test_score']
params = grid_result.cv_results_['params']
for mean, stdev, param in zip(means, stds, params):
    print("%f (%f) with: %r" % (mean, stdev, param))

Running the example prints the best result as well as the results from all combinations evaluated.

Best: 0.945333 using {'C': 0.01, 'penalty': 'l2', 'solver': 'liblinear'}
0.936333 (0.016829) with: {'C': 100, 'penalty': 'l2', 'solver': 'newton-cg'}
0.937667 (0.017259) with: {'C': 100, 'penalty': 'l2', 'solver': 'lbfgs'}
0.938667 (0.015861) with: {'C': 100, 'penalty': 'l2', 'solver': 'liblinear'}
0.936333 (0.017413) with: {'C': 10, 'penalty': 'l2', 'solver': 'newton-cg'}
0.938333 (0.017904) with: {'C': 10, 'penalty': 'l2', 'solver': 'lbfgs'}
0.939000 (0.016401) with: {'C': 10, 'penalty': 'l2', 'solver': 'liblinear'}
0.937333 (0.017114) with: {'C': 1.0, 'penalty': 'l2', 'solver': 'newton-cg'}
0.939000 (0.017195) with: {'C': 1.0, 'penalty': 'l2', 'solver': 'lbfgs'}
0.939000 (0.015780) with: {'C': 1.0, 'penalty': 'l2', 'solver': 'liblinear'}
0.940000 (0.015706) with: {'C': 0.1, 'penalty': 'l2', 'solver': 'newton-cg'}
0.940333 (0.014941) with: {'C': 0.1, 'penalty': 'l2', 'solver': 'lbfgs'}
0.941000 (0.017000) with: {'C': 0.1, 'penalty': 'l2', 'solver': 'liblinear'}
0.943000 (0.016763) with: {'C': 0.01, 'penalty': 'l2', 'solver': 'newton-cg'}
0.943000 (0.016763) with: {'C': 0.01, 'penalty': 'l2', 'solver': 'lbfgs'}
0.945333 (0.017651) with: {'C': 0.01, 'penalty': 'l2', 'solver': 'liblinear'}

Ridge Classifier

Ridge regression is a penalized linear regression model for predicting a numerical value.

Nevertheless, it can be very effective when applied to classification.

Perhaps the most important parameter to tune is the regularization strength (alpha). A good starting point might be values in the range [0.1 to 1.0]

  • alpha in [0.1, 0.2, 0.3, 0.4, 0.5, 0.6, 0.7, 0.8, 0.9, 1.0]

For the full list of hyperparameters, see:

The example below demonstrates grid searching the key hyperparameters for RidgeClassifier on a synthetic binary classification dataset.

# example of grid searching key hyperparametres for ridge classifier
from sklearn.datasets.samples_generator import make_blobs
from sklearn.model_selection import RepeatedStratifiedKFold
from sklearn.model_selection import GridSearchCV
from sklearn.linear_model import RidgeClassifier
# define dataset
X, y = make_blobs(n_samples=1000, centers=2, n_features=100, cluster_std=20)
# define models and parameters
model = RidgeClassifier()
alpha = [0.1, 0.2, 0.3, 0.4, 0.5, 0.6, 0.7, 0.8, 0.9, 1.0]
# define grid search
grid = dict(alpha=alpha)
cv = RepeatedStratifiedKFold(n_splits=10, n_repeats=3, random_state=1)
grid_search = GridSearchCV(estimator=model, param_grid=grid, n_jobs=-1, cv=cv, scoring='accuracy',error_score=0)
grid_result = grid_search.fit(X, y)
# summarize results
print("Best: %f using %s" % (grid_result.best_score_, grid_result.best_params_))
means = grid_result.cv_results_['mean_test_score']
stds = grid_result.cv_results_['std_test_score']
params = grid_result.cv_results_['params']
for mean, stdev, param in zip(means, stds, params):
    print("%f (%f) with: %r" % (mean, stdev, param))

Running the example prints the best result as well as the results from all combinations evaluated.

Best: 0.974667 using {'alpha': 0.1}
0.974667 (0.014545) with: {'alpha': 0.1}
0.974667 (0.014545) with: {'alpha': 0.2}
0.974667 (0.014545) with: {'alpha': 0.3}
0.974667 (0.014545) with: {'alpha': 0.4}
0.974667 (0.014545) with: {'alpha': 0.5}
0.974667 (0.014545) with: {'alpha': 0.6}
0.974667 (0.014545) with: {'alpha': 0.7}
0.974667 (0.014545) with: {'alpha': 0.8}
0.974667 (0.014545) with: {'alpha': 0.9}
0.974667 (0.014545) with: {'alpha': 1.0}

K-Nearest Neighbors (KNN)

The most important hyperparameter for KNN is the number of neighbors (n_neighbors).

Test values between at least 1 and 21, perhaps just the odd numbers.

  • n_neighbors in [1 to 21]

It may also be interesting to test different distance metrics (metric) for choosing the composition of the neighborhood.

  • metric in [‘euclidean’, ‘manhattan’, ‘minkowski’]

For a fuller list see:

It may also be interesting to test the contribution of members of the neighborhood via different weightings (weights).

  • weights in [‘uniform’, ‘distance’]

For the full list of hyperparameters, see:

The example below demonstrates grid searching the key hyperparameters for KNeighborsClassifier on a synthetic binary classification dataset.

# example of grid searching key hyperparametres for KNeighborsClassifier
from sklearn.datasets.samples_generator import make_blobs
from sklearn.model_selection import RepeatedStratifiedKFold
from sklearn.model_selection import GridSearchCV
from sklearn.neighbors import KNeighborsClassifier
# define dataset
X, y = make_blobs(n_samples=1000, centers=2, n_features=100, cluster_std=20)
# define models and parameters
model = KNeighborsClassifier()
n_neighbors = range(1, 21, 2)
weights = ['uniform', 'distance']
metric = ['euclidean', 'manhattan', 'minkowski']
# define grid search
grid = dict(n_neighbors=n_neighbors,weights=weights,metric=metric)
cv = RepeatedStratifiedKFold(n_splits=10, n_repeats=3, random_state=1)
grid_search = GridSearchCV(estimator=model, param_grid=grid, n_jobs=-1, cv=cv, scoring='accuracy',error_score=0)
grid_result = grid_search.fit(X, y)
# summarize results
print("Best: %f using %s" % (grid_result.best_score_, grid_result.best_params_))
means = grid_result.cv_results_['mean_test_score']
stds = grid_result.cv_results_['std_test_score']
params = grid_result.cv_results_['params']
for mean, stdev, param in zip(means, stds, params):
    print("%f (%f) with: %r" % (mean, stdev, param))

Running the example prints the best result as well as the results from all combinations evaluated.

Best: 0.937667 using {'metric': 'manhattan', 'n_neighbors': 13, 'weights': 'uniform'}
0.833667 (0.031674) with: {'metric': 'euclidean', 'n_neighbors': 1, 'weights': 'uniform'}
0.833667 (0.031674) with: {'metric': 'euclidean', 'n_neighbors': 1, 'weights': 'distance'}
0.895333 (0.030081) with: {'metric': 'euclidean', 'n_neighbors': 3, 'weights': 'uniform'}
0.895333 (0.030081) with: {'metric': 'euclidean', 'n_neighbors': 3, 'weights': 'distance'}
0.909000 (0.021810) with: {'metric': 'euclidean', 'n_neighbors': 5, 'weights': 'uniform'}
0.909000 (0.021810) with: {'metric': 'euclidean', 'n_neighbors': 5, 'weights': 'distance'}
0.925333 (0.020774) with: {'metric': 'euclidean', 'n_neighbors': 7, 'weights': 'uniform'}
0.925333 (0.020774) with: {'metric': 'euclidean', 'n_neighbors': 7, 'weights': 'distance'}
0.929000 (0.027368) with: {'metric': 'euclidean', 'n_neighbors': 9, 'weights': 'uniform'}
0.929000 (0.027368) with: {'metric': 'euclidean', 'n_neighbors': 9, 'weights': 'distance'}
...

Support Vector Machine (SVM)

The SVM algorithm, like gradient boosting, is very popular, very effective, and provides a large number of hyperparameters to tune.

Perhaps the first important parameter is the choice of kernel that will control the manner in which the input variables will be projected. There are many to choose from, but linear, polynomial, and RBF are the most common, perhaps just linear and RBF in practice.

  • kernels in [‘linear’, ‘poly’, ‘rbf’, ‘sigmoid’]

If the polynomial kernel works out, then it is a good idea to dive into the degree hyperparameter.

Another critical parameter is the penalty (C) that can take on a range of values and has a dramatic effect on the shape of the resulting regions for each class. A log scale might be a good starting point.

  • C in [100, 10, 1.0, 0.1, 0.001]

For the full list of hyperparameters, see:

The example below demonstrates grid searching the key hyperparameters for SVC on a synthetic binary classification dataset.

# example of grid searching key hyperparametres for SVC
from sklearn.datasets.samples_generator import make_blobs
from sklearn.model_selection import RepeatedStratifiedKFold
from sklearn.model_selection import GridSearchCV
from sklearn.svm import SVC
# define dataset
X, y = make_blobs(n_samples=1000, centers=2, n_features=100, cluster_std=20)
# define model and parameters
model = SVC()
kernel = ['poly', 'rbf', 'sigmoid']
C = [50, 10, 1.0, 0.1, 0.01]
gamma = ['scale']
# define grid search
grid = dict(kernel=kernel,C=C,gamma=gamma)
cv = RepeatedStratifiedKFold(n_splits=10, n_repeats=3, random_state=1)
grid_search = GridSearchCV(estimator=model, param_grid=grid, n_jobs=-1, cv=cv, scoring='accuracy',error_score=0)
grid_result = grid_search.fit(X, y)
# summarize results
print("Best: %f using %s" % (grid_result.best_score_, grid_result.best_params_))
means = grid_result.cv_results_['mean_test_score']
stds = grid_result.cv_results_['std_test_score']
params = grid_result.cv_results_['params']
for mean, stdev, param in zip(means, stds, params):
    print("%f (%f) with: %r" % (mean, stdev, param))

Running the example prints the best result as well as the results from all combinations evaluated.

Best: 0.974333 using {'C': 1.0, 'gamma': 'scale', 'kernel': 'poly'}
0.973667 (0.012512) with: {'C': 50, 'gamma': 'scale', 'kernel': 'poly'}
0.970667 (0.018062) with: {'C': 50, 'gamma': 'scale', 'kernel': 'rbf'}
0.945333 (0.024594) with: {'C': 50, 'gamma': 'scale', 'kernel': 'sigmoid'}
0.973667 (0.012512) with: {'C': 10, 'gamma': 'scale', 'kernel': 'poly'}
0.970667 (0.018062) with: {'C': 10, 'gamma': 'scale', 'kernel': 'rbf'}
0.957000 (0.016763) with: {'C': 10, 'gamma': 'scale', 'kernel': 'sigmoid'}
0.974333 (0.012565) with: {'C': 1.0, 'gamma': 'scale', 'kernel': 'poly'}
0.971667 (0.016948) with: {'C': 1.0, 'gamma': 'scale', 'kernel': 'rbf'}
0.966333 (0.016224) with: {'C': 1.0, 'gamma': 'scale', 'kernel': 'sigmoid'}
0.972333 (0.013585) with: {'C': 0.1, 'gamma': 'scale', 'kernel': 'poly'}
0.974000 (0.013317) with: {'C': 0.1, 'gamma': 'scale', 'kernel': 'rbf'}
0.971667 (0.015934) with: {'C': 0.1, 'gamma': 'scale', 'kernel': 'sigmoid'}
0.972333 (0.013585) with: {'C': 0.01, 'gamma': 'scale', 'kernel': 'poly'}
0.973667 (0.014716) with: {'C': 0.01, 'gamma': 'scale', 'kernel': 'rbf'}
0.974333 (0.013828) with: {'C': 0.01, 'gamma': 'scale', 'kernel': 'sigmoid'}

Bagged Decision Trees (Bagging)

The most important parameter for bagged decision trees is the number of trees (n_estimators).

Ideally, this should be increased until no further improvement is seen in the model.

Good values might be a log scale from 10 to 1,000.

  • n_estimators in [10, 100, 1000]

For the full list of hyperparameters, see:

The example below demonstrates grid searching the key hyperparameters for BaggingClassifier on a synthetic binary classification dataset.

# example of grid searching key hyperparameters for BaggingClassifier
from sklearn.datasets.samples_generator import make_blobs
from sklearn.model_selection import RepeatedStratifiedKFold
from sklearn.model_selection import GridSearchCV
from sklearn.ensemble import BaggingClassifier
# define dataset
X, y = make_blobs(n_samples=1000, centers=2, n_features=100, cluster_std=20)
# define models and parameters
model = BaggingClassifier()
n_estimators = [10, 100, 1000]
# define grid search
grid = dict(n_estimators=n_estimators)
cv = RepeatedStratifiedKFold(n_splits=10, n_repeats=3, random_state=1)
grid_search = GridSearchCV(estimator=model, param_grid=grid, n_jobs=-1, cv=cv, scoring='accuracy',error_score=0)
grid_result = grid_search.fit(X, y)
# summarize results
print("Best: %f using %s" % (grid_result.best_score_, grid_result.best_params_))
means = grid_result.cv_results_['mean_test_score']
stds = grid_result.cv_results_['std_test_score']
params = grid_result.cv_results_['params']
for mean, stdev, param in zip(means, stds, params):
    print("%f (%f) with: %r" % (mean, stdev, param))

Running the example prints the best result as well as the results from all combinations evaluated.

Best: 0.873667 using {'n_estimators': 1000}
0.839000 (0.038588) with: {'n_estimators': 10}
0.869333 (0.030434) with: {'n_estimators': 100}
0.873667 (0.035070) with: {'n_estimators': 1000}

Random Forest

The most important parameter is the number of random features to sample at each split point (max_features).

You could try a range of integer values, such as 1 to 20, or 1 to half the number of input features.

  • max_features [1 to 20]

Alternately, you could try a suite of different default value calculators.

  • max_features in [‘sqrt’, ‘log2’]

Another important parameter for random forest is the number of trees (n_estimators).

Ideally, this should be increased until no further improvement is seen in the model.

Good values might be a log scale from 10 to 1,000.

  • n_estimators in [10, 100, 1000]

For the full list of hyperparameters, see:

The example below demonstrates grid searching the key hyperparameters for BaggingClassifier on a synthetic binary classification dataset.

# example of grid searching key hyperparameters for RandomForestClassifier
from sklearn.datasets.samples_generator import make_blobs
from sklearn.model_selection import RepeatedStratifiedKFold
from sklearn.model_selection import GridSearchCV
from sklearn.ensemble import RandomForestClassifier
# define dataset
X, y = make_blobs(n_samples=1000, centers=2, n_features=100, cluster_std=20)
# define models and parameters
model = RandomForestClassifier()
n_estimators = [10, 100, 1000]
max_features = ['sqrt', 'log2']
# define grid search
grid = dict(n_estimators=n_estimators,max_features=max_features)
cv = RepeatedStratifiedKFold(n_splits=10, n_repeats=3, random_state=1)
grid_search = GridSearchCV(estimator=model, param_grid=grid, n_jobs=-1, cv=cv, scoring='accuracy',error_score=0)
grid_result = grid_search.fit(X, y)
# summarize results
print("Best: %f using %s" % (grid_result.best_score_, grid_result.best_params_))
means = grid_result.cv_results_['mean_test_score']
stds = grid_result.cv_results_['std_test_score']
params = grid_result.cv_results_['params']
for mean, stdev, param in zip(means, stds, params):
    print("%f (%f) with: %r" % (mean, stdev, param))

Running the example prints the best result as well as the results from all combinations evaluated.

Best: 0.952000 using {'max_features': 'log2', 'n_estimators': 1000}
0.841000 (0.032078) with: {'max_features': 'sqrt', 'n_estimators': 10}
0.938333 (0.020830) with: {'max_features': 'sqrt', 'n_estimators': 100}
0.944667 (0.024998) with: {'max_features': 'sqrt', 'n_estimators': 1000}
0.817667 (0.033235) with: {'max_features': 'log2', 'n_estimators': 10}
0.940667 (0.021592) with: {'max_features': 'log2', 'n_estimators': 100}
0.952000 (0.019562) with: {'max_features': 'log2', 'n_estimators': 1000}

Stochastic Gradient Boosting

Also called Gradient Boosting Machine (GBM) or named for the specific implementation, such as XGBoost.

The gradient boosting algorithm has many parameters to tune.

There are some parameter pairings that are important to consider. The first is the learning rate, also called shrinkage or eta (learning_rate) and the number of trees in the model (n_estimators). Both could be considered on a log scale, although in different directions.

  • learning_rate in [0.001, 0.01, 0.1]
  • n_estimators [10, 100, 1000]

Another pairing is the number of rows or subset of the data to consider for each tree (subsample) and the depth of each tree (max_depth). These could be grid searched at a 0.1 and 1 interval respectively, although common values can be tested directly.

  • subsample in [0.5, 0.7, 1.0]
  • max_depth in [3, 7, 9]

For more detailed advice on tuning the XGBoost implementation, see:

For the full list of hyperparameters, see:

The example below demonstrates grid searching the key hyperparameters for GradientBoostingClassifier on a synthetic binary classification dataset.

# example of grid searching key hyperparameters for GradientBoostingClassifier
from sklearn.datasets.samples_generator import make_blobs
from sklearn.model_selection import RepeatedStratifiedKFold
from sklearn.model_selection import GridSearchCV
from sklearn.ensemble import GradientBoostingClassifier
# define dataset
X, y = make_blobs(n_samples=1000, centers=2, n_features=100, cluster_std=20)
# define models and parameters
model = GradientBoostingClassifier()
n_estimators = [10, 100, 1000]
learning_rate = [0.001, 0.01, 0.1]
subsample = [0.5, 0.7, 1.0]
max_depth = [3, 7, 9]
# define grid search
grid = dict(learning_rate=learning_rate, n_estimators=n_estimators, subsample=subsample, max_depth=max_depth)
cv = RepeatedStratifiedKFold(n_splits=10, n_repeats=3, random_state=1)
grid_search = GridSearchCV(estimator=model, param_grid=grid, n_jobs=-1, cv=cv, scoring='accuracy',error_score=0)
grid_result = grid_search.fit(X, y)
# summarize results
print("Best: %f using %s" % (grid_result.best_score_, grid_result.best_params_))
means = grid_result.cv_results_['mean_test_score']
stds = grid_result.cv_results_['std_test_score']
params = grid_result.cv_results_['params']
for mean, stdev, param in zip(means, stds, params):
    print("%f (%f) with: %r" % (mean, stdev, param))

Running the example prints the best result as well as the results from all combinations evaluated.

Best: 0.936667 using {'learning_rate': 0.01, 'max_depth': 3, 'n_estimators': 1000, 'subsample': 0.5}
0.803333 (0.042058) with: {'learning_rate': 0.001, 'max_depth': 3, 'n_estimators': 10, 'subsample': 0.5}
0.783667 (0.042386) with: {'learning_rate': 0.001, 'max_depth': 3, 'n_estimators': 10, 'subsample': 0.7}
0.711667 (0.041157) with: {'learning_rate': 0.001, 'max_depth': 3, 'n_estimators': 10, 'subsample': 1.0}
0.832667 (0.040244) with: {'learning_rate': 0.001, 'max_depth': 3, 'n_estimators': 100, 'subsample': 0.5}
0.809667 (0.040040) with: {'learning_rate': 0.001, 'max_depth': 3, 'n_estimators': 100, 'subsample': 0.7}
0.741333 (0.043261) with: {'learning_rate': 0.001, 'max_depth': 3, 'n_estimators': 100, 'subsample': 1.0}
0.881333 (0.034130) with: {'learning_rate': 0.001, 'max_depth': 3, 'n_estimators': 1000, 'subsample': 0.5}
0.866667 (0.035150) with: {'learning_rate': 0.001, 'max_depth': 3, 'n_estimators': 1000, 'subsample': 0.7}
0.838333 (0.037424) with: {'learning_rate': 0.001, 'max_depth': 3, 'n_estimators': 1000, 'subsample': 1.0}
0.838333 (0.036614) with: {'learning_rate': 0.001, 'max_depth': 7, 'n_estimators': 10, 'subsample': 0.5}
0.821667 (0.040586) with: {'learning_rate': 0.001, 'max_depth': 7, 'n_estimators': 10, 'subsample': 0.7}
0.729000 (0.035903) with: {'learning_rate': 0.001, 'max_depth': 7, 'n_estimators': 10, 'subsample': 1.0}
0.884667 (0.036854) with: {'learning_rate': 0.001, 'max_depth': 7, 'n_estimators': 100, 'subsample': 0.5}
0.871333 (0.035094) with: {'learning_rate': 0.001, 'max_depth': 7, 'n_estimators': 100, 'subsample': 0.7}
0.729000 (0.037625) with: {'learning_rate': 0.001, 'max_depth': 7, 'n_estimators': 100, 'subsample': 1.0}
0.905667 (0.033134) with: {'learning_rate': 0.001, 'max_depth': 7, 'n_estimators': 1000, 'subsample': 0.5}
...

Further Reading

This section provides more resources on the topic if you are looking to go deeper.

Summary

In this tutorial, you discovered the top hyperparameters and how to configure them for top machine learning algorithms.

Do you have other hyperparameter suggestions? Let me know in the comments below.

Do you have any questions?
Ask your questions in the comments below and I will do my best to answer.

The post Tune Hyperparameters for Classification Machine Learning Algorithms appeared first on Machine Learning Mastery.
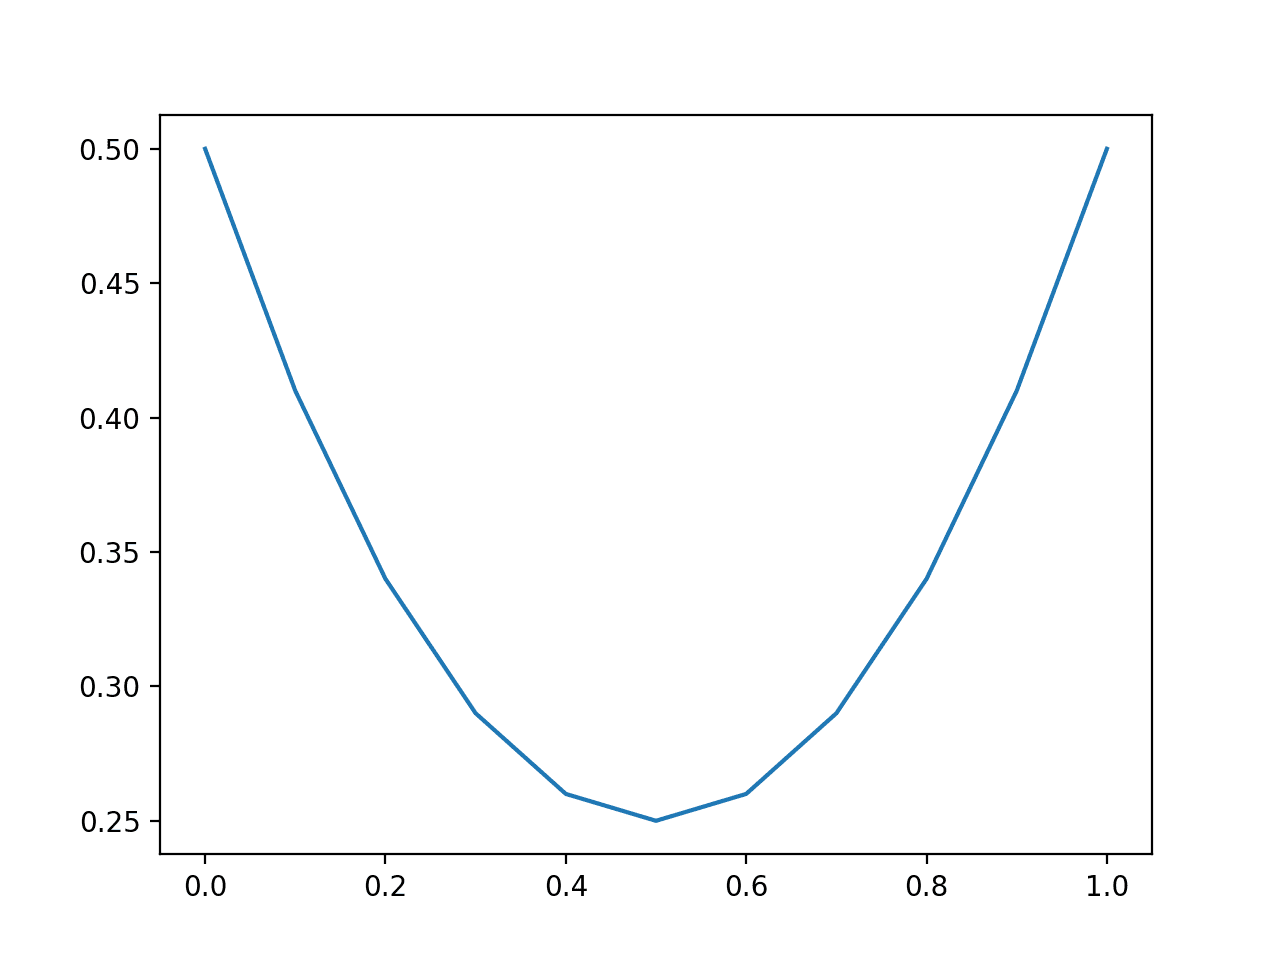
How to Transform Target Variables for Regression With Scikit-Learn

$
0
0

Data preparation is a big part of applied machine learning.

Correctly preparing your training data can mean the difference between mediocre and extraordinary results, even with very simple linear algorithms.

Performing data preparation operations, such as scaling, is relatively straightforward for input variables and has been made routine in Python via the Pipeline scikit-learn class.

On regression predictive modeling problems where a numerical value must be predicted, it can also be critical to scale and perform other data transformations on the target variable. This can be achieved in Python using the TransformedTargetRegressor class.

In this tutorial, you will discover how to use the TransformedTargetRegressor to scale and transform target variables for regression using the scikit-learn Python machine learning library.

After completing this tutorial, you will know:

  • The importance of scaling input and target data for machine learning.
  • The two approaches to applying data transforms to target variables.
  • How to use the TransformedTargetRegressor on a real regression dataset.

Let’s get started.

How to Transform Target Variables for Regression With Scikit-Learn

How to Transform Target Variables for Regression With Scikit-Learn
Photo by Don Henise, some rights reserved.

Tutorial Overview

This tutorial is divided into three parts; they are:

  1. Importance of Data Scaling
  2. How to Scale Target Variables
  3. Example of Using the TransformedTargetRegressor

Importance of Data Scaling

It is common to have data where the scale of values differs from variable to variable.

For example, one variable may be in feet, another in meters, and so on.

Some machine learning algorithms perform much better if all of the variables are scaled to the same range, such as scaling all variables to values between 0 and 1, called normalization.

This effects algorithms that use a weighted sum of the input, like linear models and neural networks, as well as models that use distance measures such as support vector machines and k-nearest neighbors.

As such, it is a good practice to scale input data, and perhaps even try other data transforms such as making the data more normal (better fit a Gaussian probability distribution) using a power transform.

This also applies to output variables, called target variables, such as numerical values that are predicted when modeling regression predictive modeling problems.

For regression problems, it is often desirable to scale or transform both the input and the target variables.

Scaling input variables is straightforward. In scikit-learn, you can use the scale objects manually, or the more convenient Pipeline that allows you to chain a series of data transform objects together before using your model.

The Pipeline will fit the scale objects on the training data for you and apply the transform to new data, such as when using a model to make a prediction.

For example:

...
# prepare the model with input scaling
pipeline = Pipeline(steps=[('normalize', MinMaxScaler()), ('model', LinearRegression())])
# fit pipeline
pipeline.fit(train_x, train_y)
# make predictions
yhat = pipeline.predict(test_x)

The challenge is, what is the equivalent mechanism to scale target variables in scikit-learn?

How to Scale Target Variables

There are two ways that you can scale target variables.

The first is to manually manage the transform, and the second is to use a new automatic way for managing the transform.

  1. Manually transform the target variable.
  2. Automatically transform the target variable.

1. Manual Transform of the Target Variable

Manually managing the scaling of the target variable involves creating and applying the scaling object to the data manually.

It involves the following steps:

  1. Create the transform object, e.g. a MinMaxScaler.
  2. Fit the transform on the training dataset.
  3. Apply the transform to the train and test datasets.
  4. Invert the transform on any predictions made.

For example, if we wanted to normalize a target variable, we would first define and train a MinMaxScaler object:

# create target scaler object
...
target_scaler = MinMaxScaler()
target_scaler.fit(train_y)

We would then transform the train and test target variable data.

# transform target variables
...
train_y = target_scaler.transform(train_y)
test_y = target_scaler.transform(test_y)

Then we would fit our model and use the model to make predictions.

Before the predictions can be used or evaluated with an error metric, we would have to invert the transform.

# invert transform on predictions
...
yhat = model.predict(test_X)
yhat = target_scaler.inverse_transform(yhat)

This is a pain, as it means you cannot use convenience functions in scikit-learn, such as cross_val_score(), to quickly evaluate a model.

2. Automatic Transform of the Target Variable

An alternate approach is to automatically manage the transform and inverse transform.

This can be achieved by using the TransformedTargetRegressor object that wraps a given model and a scaling object.

It will prepare the transform of the target variable using the same training data used to fit the model, then apply that inverse transform on any new data provided when calling fit(), returning predictions in the correct scale.

To use the TransformedTargetRegressor, it is defined by specifying the model and the transform object to use on the target; for example:

# define the target transform wrapper
wrapped_model = TransformedTargetRegressor(regressor=model, transformer=MinMaxScaler())

Later, the TransformedTargetRegressor instance can be fit like any other model by calling the fit() function and used to make predictions by calling the predict() function.

# use the target transform wrapper
...
wrapped_model.fit(train_X, train_y)
yhat = wrapped_model.predict(test_X)

This is much easier and allows you to use helpful functions like cross_val_score() to evaluate a model

Now that we are familiar with the TransformedTargetRegressor, let’s look at an example of using it on a real dataset.

Example of Using the TransformedTargetRegressor

In this section, we will demonstrate how to use the TransformedTargetRegressor on a real dataset.

We will use the Boston housing regression problem that has 13 inputs and one numerical target and requires learning the relationship between suburb characteristics and house prices.

The dataset can be downloaded from here:

Download the dataset and save it in your current working directory with the name “housing.csv“.

Looking in the dataset, you should see that all variables are numeric.

0.00632,18.00,2.310,0,0.5380,6.5750,65.20,4.0900,1,296.0,15.30,396.90,4.98,24.00
0.02731,0.00,7.070,0,0.4690,6.4210,78.90,4.9671,2,242.0,17.80,396.90,9.14,21.60
0.02729,0.00,7.070,0,0.4690,7.1850,61.10,4.9671,2,242.0,17.80,392.83,4.03,34.70
0.03237,0.00,2.180,0,0.4580,6.9980,45.80,6.0622,3,222.0,18.70,394.63,2.94,33.40
0.06905,0.00,2.180,0,0.4580,7.1470,54.20,6.0622,3,222.0,18.70,396.90,5.33,36.20
...

You can learn more about this dataset and the meanings of the columns here:

We can confirm that the dataset can be loaded correctly as a NumPy array and split it into input and output variables.

The complete example is listed below.

# load and summarize the dataset
from numpy import loadtxt
# load data
dataset = loadtxt('housing.csv', delimiter=",")
# split into inputs and outputs
X, y = dataset[:, :-1], dataset[:, -1]
# summarize dataset
print(X.shape, y.shape)

Running the example prints the shape of the input and output parts of the dataset, showing 13 input variables, one output variable, and 506 rows of data.

(506, 13) (506,)

We can now prepare an example of using the TransformedTargetRegressor.

A naive regression model that predicts the mean value of the target on this problem can achieve a mean absolute error (MAE) of about 6.659. We will aim to do better.

In this example, we will fit a HuberRegressor object and normalize the input variables using a Pipeline.

...
# prepare the model with input scaling
pipeline = Pipeline(steps=[('normalize', MinMaxScaler()), ('model', HuberRegressor())])

Next, we will define a TransformedTargetRegressor instance and set the regressor to the pipeline and the transformer to an instance of a MinMaxScaler object.

...
# prepare the model with target scaling
model = TransformedTargetRegressor(regressor=pipeline, transformer=MinMaxScaler())

We can then evaluate the model with normalization of the input and output variables using 10-fold cross-validation.

...
# evaluate model
cv = KFold(n_splits=10, shuffle=True, random_state=1)
scores = cross_val_score(model, X, y, scoring='neg_mean_absolute_error', cv=cv, n_jobs=-1)

Tying this all together, the complete example is listed below.

# example of normalizing input and output variables for regression.
from numpy import mean
from numpy import absolute
from numpy import loadtxt
from sklearn.model_selection import cross_val_score
from sklearn.model_selection import KFold
from sklearn.pipeline import Pipeline
from sklearn.linear_model import HuberRegressor
from sklearn.preprocessing import MinMaxScaler
from sklearn.compose import TransformedTargetRegressor
# load data
dataset = loadtxt('housing.csv', delimiter=",")
# split into inputs and outputs
X, y = dataset[:, :-1], dataset[:, -1]
# prepare the model with input scaling
pipeline = Pipeline(steps=[('normalize', MinMaxScaler()), ('model', HuberRegressor())])
# prepare the model with target scaling
model = TransformedTargetRegressor(regressor=pipeline, transformer=MinMaxScaler())
# evaluate model
cv = KFold(n_splits=10, shuffle=True, random_state=1)
scores = cross_val_score(model, X, y, scoring='neg_mean_absolute_error', cv=cv, n_jobs=-1)
# convert scores to positive
scores = absolute(scores)
# summarize the result
s_mean = mean(scores)
print('Mean MAE: %.3f' % (s_mean))

Running the example evaluates the model with normalization of the input and output variables.

Your specific results may vary given the stochastic learning algorithm and differences in library versions.

In this case, we achieve a MAE of about 3.1, much better than a naive model that achieved about 6.6.

Mean MAE: 3.191

We are not restricted to using scaling objects; for example, we can also explore using other data transforms on the target variable, such as the PowerTransformer, that can make each variable more-Gaussian-like (using the Yeo-Johnson transform) and improve the performance of linear models.

By default, the PowerTransformer also performs a standardization of each variable after performing the transform.

The complete example of using a PowerTransformer on the input and target variables of the housing dataset is listed below.

# example of power transform input and output variables for regression.
from numpy import mean
from numpy import absolute
from numpy import loadtxt
from sklearn.model_selection import cross_val_score
from sklearn.model_selection import KFold
from sklearn.pipeline import Pipeline
from sklearn.linear_model import HuberRegressor
from sklearn.preprocessing import PowerTransformer
from sklearn.compose import TransformedTargetRegressor
# load data
dataset = loadtxt('housing.csv', delimiter=",")
# split into inputs and outputs
X, y = dataset[:, :-1], dataset[:, -1]
# prepare the model with input scaling
pipeline = Pipeline(steps=[('power', PowerTransformer()), ('model', HuberRegressor())])
# prepare the model with target scaling
model = TransformedTargetRegressor(regressor=pipeline, transformer=PowerTransformer())
# evaluate model
cv = KFold(n_splits=10, shuffle=True, random_state=1)
scores = cross_val_score(model, X, y, scoring='neg_mean_absolute_error', cv=cv, n_jobs=-1)
# convert scores to positive
scores = absolute(scores)
# summarize the result
s_mean = mean(scores)
print('Mean MAE: %.3f' % (s_mean))

Running the example evaluates the model with a power transform of the input and output variables.

Your specific results may vary given the stochastic learning algorithm and differences in library versions.

In this case, we see further improvement to a MAE of about 2.9.

Mean MAE: 2.926

Further Reading

This section provides more resources on the topic if you are looking to go deeper.

API

Articles

Summary

In this tutorial, you discovered how to use the TransformedTargetRegressor to scale and transform target variables for regression in scikit-learn.

Specifically, you learned:

  • The importance of scaling input and target data for machine learning.
  • The two approaches to applying data transforms to target variables.
  • How to use the TransformedTargetRegressor on a real regression dataset.

Do you have any questions?
Ask your questions in the comments below and I will do my best to answer.

The post How to Transform Target Variables for Regression With Scikit-Learn appeared first on Machine Learning Mastery.
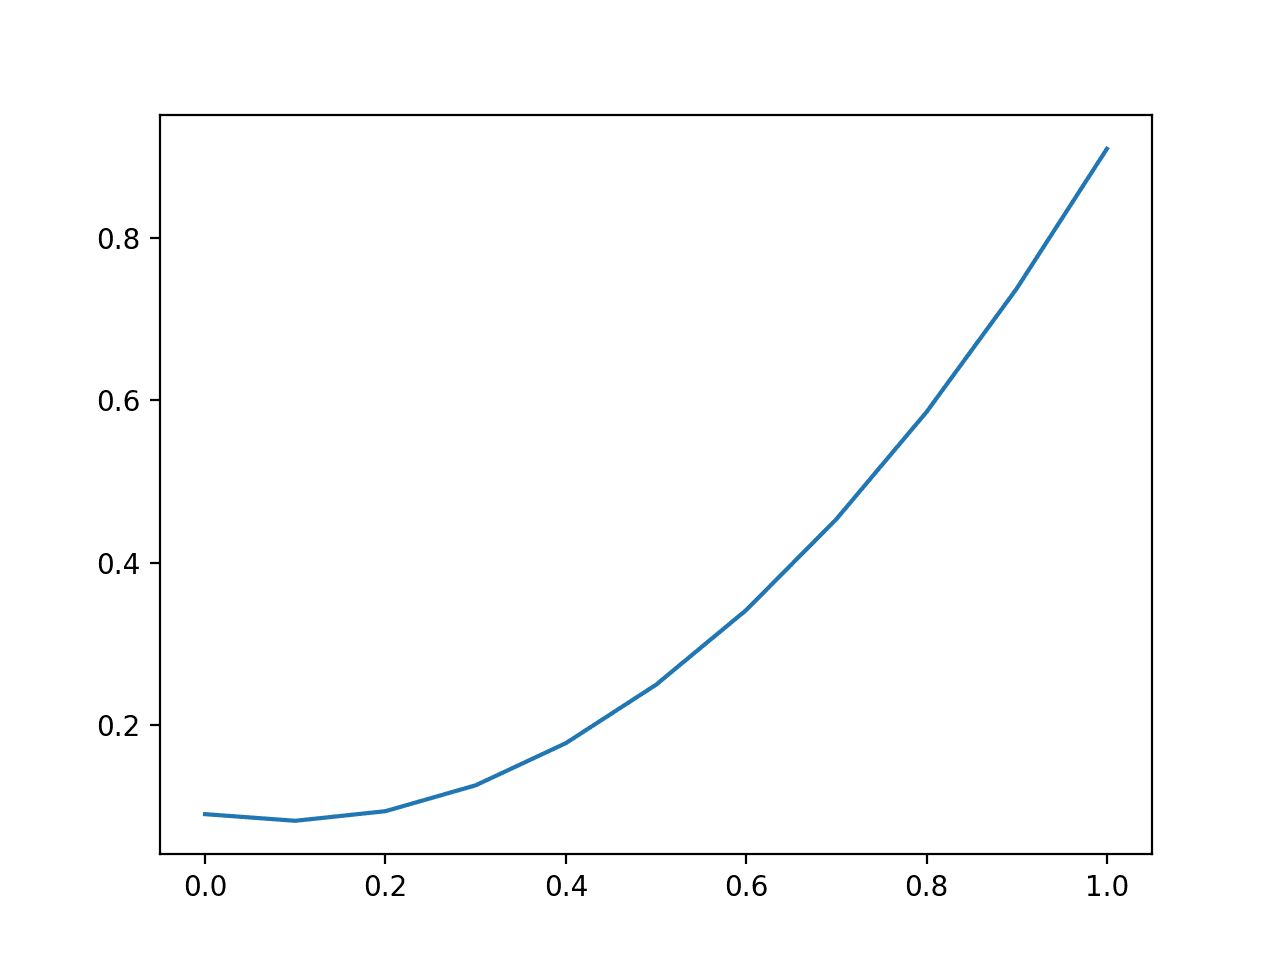
Results for Standard Classification and Regression Machine Learning Datasets

$
0
0

It is important that beginner machine learning practitioners practice on small real-world datasets.

So-called standard machine learning datasets contain actual observations, fit into memory, and are well studied and well understood. As such, they can be used by beginner practitioners to quickly test, explore, and practice data preparation and modeling techniques.

A practitioner can confirm whether they have the data skills required to achieve a good result on a standard machine learning dataset. A good result is a result that is above the 80th or 90th percentile result of what may be technically possible for a given dataset.

The skills developed by practitioners on standard machine learning datasets can provide the foundation for tackling larger, more challenging projects.

In this post, you will discover standard machine learning datasets for classification and regression and the baseline and good results that one may expect to achieve on each.

After reading this post, you will know:

  • The importance of standard machine learning datasets.
  • How to systematically evaluate a model on a standard machine learning dataset.
  • Standard datasets for classification and regression and the baseline and good performance expected on each.

Let’s get started.

Results for Standard Classification and Regression Machine Learning Datasets

Results for Standard Classification and Regression Machine Learning Datasets
Photo by Don Dearing, some rights reserved.

Overview

This tutorial is divided into seven parts; they are:

  1. Value of Small Machine Learning Datasets
  2. Definition of a Standard Machine Learning Dataset
  3. Standard Machine Learning Datasets
  4. Good Results for Standard Datasets
  5. Model Evaluation Methodology
  6. Results for Classification Datasets
    1. Binary Classification Datasets
      1. Ionosphere
      2. Pima Indian Diabetes
      3. Sonar
      4. Wisconsin Breast Cancer
      5. Horse Colic
    2. Multiclass Classification Datasets
      1. Iris Flowers
      2. Glass
      3. Wine
      4. Wheat Seeds
  7. Results for Regression Datasets
    1. Housing
    2. Auto Insurance
    3. Abalone
    4. Auto Imports

Value of Small Machine Learning Datasets

There are a number of small machine learning datasets for classification and regression predictive modeling problems that are frequently reused.

Sometimes the datasets are used as the basis for demonstrating a machine learning or data preparation technique. Other times, they are used as a basis for comparing different techniques.

These datasets were collected and made publicly available in the early days of applied machine learning when data and real-world datasets were scarce. As such, they have become a standard or canonized from their wide adoption and reuse alone, not for any intrinsic interestingness in the problems.

Finding a good model on one of these datasets does not mean you have “solved” the general problem. Also, some of the datasets may contain names or indicators that might be considered questionable or culturally insensitive (which was very likely not the intent when the data was collected). As such, they are also sometimes referred to as “toy” datasets.

Such datasets are not really useful for points of comparison for machine learning algorithms, as most empirical experiments are nearly impossible to reproduce.

Nevertheless, such datasets are valuable in the field of applied machine learning today. Even in the era of standard machine learning libraries, big data, and the abundance of data.

There are three main reasons why they are valuable; they are:

  1. The datasets are real.
  2. The datasets are small.
  3. The datasets are understood.

Real datasets are useful as compared to contrived datasets because they are messy. There may be and are measurement errors, missing values, mislabeled examples, and more. Some or all of these issues must be searched for and addressed, and are some of the properties we may encounter when working on our own projects.

Small datasets are useful as compared to large datasets that may be many gigabytes in size. Small datasets can easily fit into memory and allow for the testing and exploration of many different data visualization, data preparation, and modeling algorithms easily and quickly. Speed of testing ideas and getting feedback is critical for beginners, and small datasets facilitate exactly this.

Understood datasets are useful as compared to new or newly created datasets. The features are well defined, the units of the features are specified, the source of the data is known, and the dataset has been well studied in tens, hundreds, and in some cases, thousands of research projects and papers. This provides a context in which results can be compared and evaluated, a property not available in entirely new domains.

Given these properties, I strongly advocate machine learning beginners (and practitioners that are new to a specific technique) start with standard machine learning datasets.

Definition of a Standard Machine Learning Dataset

I would like to go one step further and define some more specific properties of a “standard” machine learning dataset.

A standard machine learning dataset has the following properties.

  • Less than 10,000 rows (samples).
  • Less than 100 columns (features).
  • Last column is the target variable.
  • Stored in a single file with CSV format and without header line.
  • Missing values marked with a question mark character (‘?’)
  • It is possible to achieve a better than naive result.

Now that we have a clear definition of a dataset, let’s look at what a “good” result means.

Standard Machine Learning Datasets

A dataset is a standard machine learning dataset if it is frequently used in books, research papers, tutorials, presentations, and more.

The best repository for these so-called classical or standard machine learning datasets is the University of California at Irvine (UCI) machine learning repository. This website categorizes datasets by type and provides a download of the data and additional information about each dataset and references relevant papers.

I have chosen five or fewer datasets for each problem type as a starting point.

All standard datasets used in this post are available on GitHub here:

Download links are also provided for each dataset and for additional details about the dataset (the so-called a “.name” file).

Each code example will automatically download a given dataset for you. If this is a problem, you can download the CSV file manually, place it in the same directory as the code example, then change the code example to use the filename instead of the URL.

For example:

...
# load dataset
dataframe = read_csv('ionosphere.csv', header=None)

Good Results for Standard Datasets

A challenge for beginners when working with standard machine learning datasets is what represents a good result.

In general, a model is skillful if it can demonstrate a performance that is better than a naive method, such as predicting the majority class in classification or the mean value in regression. This is called a baseline model or a baseline of performance that provides a relative measure of performance specific to a dataset. You can learn more about this here:

Given that we now have a method for determining whether a model has skill on a dataset, beginners remain interested in the upper limits of performance for a given dataset. This is required information to know whether you are “getting good” at the process of applied machine learning.

Good does not mean perfect predictions. All models will have prediction errors, and perfect predictions are not possible (tractable?) on real-world datasets.

Defining “good” or “best” results for a dataset is challenging because it is dependent generally on the model evaluation methodology, and specifically on the versions of the dataset and libraries used in the evaluation.

Good means “good-enough” given available resources. Often, this means a skill score that is above the 80th or 90th percentile of what might be possible for a dataset given unbounded skill, time, and computational resources.

In this tutorial, you will discover how to calculate the baseline performance and “good” (near-best) performance that is possible on each dataset. You will also discover how to specify the data preparation and model used to achieve the performance.

Rather than explain how to do this, a short Python code example is given that you can use to reproduce the baseline and good result.

Model Evaluation Methodology

The evaluation methodology is simple and fast, and generally recommended when working with small predictive modeling problems.

The procedure is evaluated as follows:

  • A model is evaluated using 10-fold cross-validation.
  • The evaluation procedure is repeated three times.
  • The random seed for the cross-validation split is the repeat number (1, 2, or 3).

This results in 30 estimates of model performance from which a mean and standard deviation can be calculated to summarize the performance of a given model.

Using the repeat number as the seed for each cross-validation split ensures that each algorithm evaluated on the dataset gets the same splits of the data, ensuring a fair direct comparison.

Using the scikit-learn Python machine learning library, the example below can be used to evaluate a given model (or Pipeline). The RepeatedStratifiedKFold class defines the number of folds and repeats for classification, and the cross_val_score() function defines the score and performs the evaluation and returns a list of scores from which a mean and standard deviation can be calculated.

...
cv = RepeatedStratifiedKFold(n_splits=10, n_repeats=3, random_state=1)
scores = cross_val_score(model, X, y, scoring='accuracy', cv=cv, n_jobs=-1, error_score='raise')

For regression we can use the RepeatedKFold class and the MAE score.

...
cv = RepeatedKFold(n_splits=10, n_repeats=3, random_state=1)
scores = cross_val_score(model, X, y, scoring='neg_mean_absolute_error', cv=cv, n_jobs=-1, error_score='raise')

The “good” scores reported are the best that I can get out of my own personal set of “get a good result fast on a given dataset” scripts. I believe the scores represent good scores that can be achieved on each dataset, perhaps in the 90th or 95th percentile of what is possible for each dataset, if not better.

That being said, I am not claiming that they are the best possible scores as I have not performed hyperparameter tuning for the well-performing models. I leave this as an exercise for interested practitioners. Best scores are not required if a practitioner can address a given dataset as getting a top percentile score is more than sufficient to demonstrate competence.

Note: I will update the results and models as I improve my own personal scripts and achieve better scores.

Can you get a better score for a dataset?
I would love to know. Share your model and score in the comments below and I will try to reproduce it and update the post (and give you full credit!)

Let’s dive in.

Results for Classification Datasets

Classification is a predictive modeling problem that predicts one label given one or more input variables.

The baseline model for classification tasks is a model that predicts the majority label. This can be achieved in scikit-learn using the DummyClassifier class with the ‘most_frequent‘ strategy; for example:

...
model = DummyClassifier(strategy='most_frequent')

The standard evaluation for classification models is classification accuracy, although this is not ideal for imbalanced and some multi-class problems. Nevertheless, for better or worse, this score will be used (for now).

Accuracy is reported as a fraction between 0 (0% or no skill) and 1 (100% or perfect skill).

There are two main types of classification tasks: binary and multi-class classification, divided based on the number of labels to be predicted for a given dataset as two or more than two respectively. Given the prevalence of classification tasks in machine learning, we will treat these two subtypes of classification problems separately.

Binary Classification Datasets

In this section, we will review the baseline and good performance on the following binary classification predictive modeling datasets:

  1. Ionosphere
  2. Pima Indian Diabetes
  3. Sonar
  4. Wisconsin Breast Cancer
  5. Horse Colic

Ionosphere

The complete code example for achieving baseline and a good result on this dataset is listed below.

# baseline and good result for Ionosphere
from numpy import mean
from numpy import std
from pandas import read_csv
from sklearn.preprocessing import LabelEncoder
from sklearn.model_selection import cross_val_score
from sklearn.model_selection import RepeatedStratifiedKFold
from sklearn.pipeline import Pipeline
from sklearn.preprocessing import StandardScaler
from sklearn.preprocessing import MinMaxScaler
from sklearn.dummy import DummyClassifier
from sklearn.svm import SVC
# load dataset
url = 'https://raw.githubusercontent.com/jbrownlee/Datasets/master/ionosphere.csv'
dataframe = read_csv(url, header=None)
data = dataframe.values
X, y = data[:, :-1], data[:, -1]
print('Shape: %s, %s' % (X.shape,y.shape))
# minimally prepare dataset
X = X.astype('float32')
y = LabelEncoder().fit_transform(y.astype('str'))
# evaluate naive
naive = DummyClassifier(strategy='most_frequent')
cv = RepeatedStratifiedKFold(n_splits=10, n_repeats=3, random_state=1)
n_scores = cross_val_score(naive, X, y, scoring='accuracy', cv=cv, n_jobs=-1, error_score='raise')
print('Baseline: %.3f (%.3f)' % (mean(n_scores), std(n_scores)))
# evaluate model
model = SVC(kernel='rbf', gamma='scale', C=10)
steps = [('s',StandardScaler()), ('n',MinMaxScaler()), ('m',model)]
pipeline = Pipeline(steps=steps)
m_scores = cross_val_score(pipeline, X, y, scoring='accuracy', cv=cv, n_jobs=-1, error_score='raise')
print('Good: %.3f (%.3f)' % (mean(m_scores), std(m_scores)))

Running the example, you should see the following results.

Shape: (351, 34), (351,)
Baseline: 0.641 (0.006)
Good: 0.948 (0.033)

Pima Indian Diabetes

The complete code example for achieving baseline and a good result on this dataset is listed below.

# baseline and good result for Pima Indian Diabetes
from numpy import mean
from numpy import std
from pandas import read_csv
from sklearn.preprocessing import LabelEncoder
from sklearn.model_selection import cross_val_score
from sklearn.model_selection import RepeatedStratifiedKFold
from sklearn.dummy import DummyClassifier
from sklearn.linear_model import LogisticRegression
# load dataset
url = 'https://raw.githubusercontent.com/jbrownlee/Datasets/master/pima-indians-diabetes.csv'
dataframe = read_csv(url, header=None)
data = dataframe.values
X, y = data[:, :-1], data[:, -1]
print('Shape: %s, %s' % (X.shape,y.shape))
# minimally prepare dataset
X = X.astype('float32')
y = LabelEncoder().fit_transform(y.astype('str'))
# evaluate naive
naive = DummyClassifier(strategy='most_frequent')
cv = RepeatedStratifiedKFold(n_splits=10, n_repeats=3, random_state=1)
n_scores = cross_val_score(naive, X, y, scoring='accuracy', cv=cv, n_jobs=-1, error_score='raise')
print('Baseline: %.3f (%.3f)' % (mean(n_scores), std(n_scores)))
# evaluate model
model = LogisticRegression(solver='newton-cg',penalty='l2',C=1)
m_scores = cross_val_score(model, X, y, scoring='accuracy', cv=cv, n_jobs=-1, error_score='raise')
print('Good: %.3f (%.3f)' % (mean(m_scores), std(m_scores)))

Running the example, you should see the following results.

Note: you may see some warnings, but they can be safely ignored.

Shape: (768, 8), (768,)
Baseline: 0.651 (0.003)
Good: 0.774 (0.055)

Sonar

The complete code example for achieving baseline and a good result on this dataset is listed below.

# baseline and good result for Sonar
from numpy import mean
from numpy import std
from pandas import read_csv
from sklearn.preprocessing import LabelEncoder
from sklearn.model_selection import cross_val_score
from sklearn.model_selection import RepeatedStratifiedKFold
from sklearn.pipeline import Pipeline
from sklearn.preprocessing import PowerTransformer
from sklearn.dummy import DummyClassifier
from sklearn.neighbors import KNeighborsClassifier
# load dataset
url = 'https://raw.githubusercontent.com/jbrownlee/Datasets/master/sonar.csv'
dataframe = read_csv(url, header=None)
data = dataframe.values
X, y = data[:, :-1], data[:, -1]
print('Shape: %s, %s' % (X.shape,y.shape))
# minimally prepare dataset
X = X.astype('float32')
y = LabelEncoder().fit_transform(y.astype('str'))
# evaluate naive
naive = DummyClassifier(strategy='most_frequent')
cv = RepeatedStratifiedKFold(n_splits=10, n_repeats=3, random_state=1)
n_scores = cross_val_score(naive, X, y, scoring='accuracy', cv=cv, n_jobs=-1, error_score='raise')
print('Baseline: %.3f (%.3f)' % (mean(n_scores), std(n_scores)))
# evaluate model
model = KNeighborsClassifier(n_neighbors=2, metric='minkowski', weights='distance')
steps = [('p',PowerTransformer()), ('m',model)]
pipeline = Pipeline(steps=steps)
m_scores = cross_val_score(pipeline, X, y, scoring='accuracy', cv=cv, n_jobs=-1, error_score='raise')
print('Good: %.3f (%.3f)' % (mean(m_scores), std(m_scores)))

Running the example, you should see the following results.

Shape: (208, 60), (208,)
Baseline: 0.534 (0.012)
Good: 0.882 (0.071)

Wisconsin Breast Cancer

The complete code example for achieving baseline and a good result on this dataset is listed below.

# baseline and good result for Wisconsin Breast Cancer
from numpy import mean
from numpy import std
from pandas import read_csv
from sklearn.preprocessing import LabelEncoder
from sklearn.model_selection import cross_val_score
from sklearn.model_selection import RepeatedStratifiedKFold
from sklearn.pipeline import Pipeline
from sklearn.preprocessing import PowerTransformer
from sklearn.impute import SimpleImputer
from sklearn.dummy import DummyClassifier
from sklearn.svm import SVC
# load dataset
url = 'https://raw.githubusercontent.com/jbrownlee/Datasets/master/breast-cancer-wisconsin.csv'
dataframe = read_csv(url, header=None, na_values='?')
data = dataframe.values
X, y = data[:, :-1], data[:, -1]
print('Shape: %s, %s' % (X.shape,y.shape))
# minimally prepare dataset
X = X.astype('float32')
y = LabelEncoder().fit_transform(y.astype('str'))
# evaluate naive
naive = DummyClassifier(strategy='most_frequent')
cv = RepeatedStratifiedKFold(n_splits=10, n_repeats=3, random_state=1)
n_scores = cross_val_score(naive, X, y, scoring='accuracy', cv=cv, n_jobs=-1, error_score='raise')
print('Baseline: %.3f (%.3f)' % (mean(n_scores), std(n_scores)))
# evaluate model
model = SVC(kernel='sigmoid', gamma='scale', C=0.1)
steps = [('i',SimpleImputer(strategy='median')), ('p',PowerTransformer()), ('m',model)]
pipeline = Pipeline(steps=steps)
m_scores = cross_val_score(pipeline, X, y, scoring='accuracy', cv=cv, n_jobs=-1, error_score='raise')
print('Good: %.3f (%.3f)' % (mean(m_scores), std(m_scores)))

Running the example, you should see the following results.

Note: you may see some warnings, but they can be safely ignored.

Shape: (699, 9), (699,)
Baseline: 0.655 (0.003)
Good: 0.973 (0.019)

Horse Colic

The complete code example for achieving baseline and a good result on this dataset is listed below.

# baseline and good result for Horse Colic
from numpy import mean
from numpy import std
from pandas import read_csv
from sklearn.preprocessing import LabelEncoder
from sklearn.model_selection import cross_val_score
from sklearn.model_selection import RepeatedStratifiedKFold
from sklearn.pipeline import Pipeline
from sklearn.impute import SimpleImputer
from sklearn.dummy import DummyClassifier
from xgboost import XGBClassifier
# load dataset
url = 'https://raw.githubusercontent.com/jbrownlee/Datasets/master/horse-colic.csv'
dataframe = read_csv(url, header=None, na_values='?')
data = dataframe.values
X, y = data[:, :-1], data[:, -1]
print('Shape: %s, %s' % (X.shape,y.shape))
# minimally prepare dataset
X = X.astype('float32')
y = LabelEncoder().fit_transform(y.astype('str'))
# evaluate naive
naive = DummyClassifier(strategy='most_frequent')
cv = RepeatedStratifiedKFold(n_splits=10, n_repeats=3, random_state=1)
n_scores = cross_val_score(naive, X, y, scoring='accuracy', cv=cv, n_jobs=-1, error_score='raise')
print('Baseline: %.3f (%.3f)' % (mean(n_scores), std(n_scores)))
# evaluate model
model = XGBClassifier(learning_rate=0.1, n_estimators=100, subsample=1, max_depth=3, colsample_bynode=0.4)
steps = [('i',SimpleImputer(strategy='median')), ('m',model)]
pipeline = Pipeline(steps=steps)
m_scores = cross_val_score(pipeline, X, y, scoring='accuracy', cv=cv, n_jobs=-1, error_score='raise')
print('Good: %.3f (%.3f)' % (mean(m_scores), std(m_scores)))

Running the example, you should see the following results.

Shape: (300, 27), (300,)
Baseline: 0.670 (0.007)
Good: 0.852 (0.048)

Multiclass Classification Datasets

In this section, we will review the baseline and good performance on the following multiclass classification predictive modeling datasets:

  1. Iris Flowers
  2. Glass
  3. Wine
  4. Wheat Seeds

Iris Flowers

The complete code example for achieving baseline and a good result on this dataset is listed below.

# baseline and good result for Iris
from numpy import mean
from numpy import std
from pandas import read_csv
from sklearn.preprocessing import LabelEncoder
from sklearn.model_selection import cross_val_score
from sklearn.model_selection import RepeatedStratifiedKFold
from sklearn.pipeline import Pipeline
from sklearn.preprocessing import PowerTransformer
from sklearn.dummy import DummyClassifier
from sklearn.discriminant_analysis import LinearDiscriminantAnalysis
# load dataset
url = 'https://raw.githubusercontent.com/jbrownlee/Datasets/master/iris.csv'
dataframe = read_csv(url, header=None)
data = dataframe.values
X, y = data[:, :-1], data[:, -1]
print('Shape: %s, %s' % (X.shape,y.shape))
# minimally prepare dataset
X = X.astype('float32')
y = LabelEncoder().fit_transform(y.astype('str'))
# evaluate naive
naive = DummyClassifier(strategy='most_frequent')
cv = RepeatedStratifiedKFold(n_splits=10, n_repeats=3, random_state=1)
n_scores = cross_val_score(naive, X, y, scoring='accuracy', cv=cv, n_jobs=-1, error_score='raise')
print('Baseline: %.3f (%.3f)' % (mean(n_scores), std(n_scores)))
# evaluate model
model = LinearDiscriminantAnalysis()
steps = [('p',PowerTransformer()), ('m',model)]
pipeline = Pipeline(steps=steps)
m_scores = cross_val_score(pipeline, X, y, scoring='accuracy', cv=cv, n_jobs=-1, error_score='raise')
print('Good: %.3f (%.3f)' % (mean(m_scores), std(m_scores)))

Running the example, you should see the following results.

Shape: (150, 4), (150,)
Baseline: 0.333 (0.000)
Good: 0.980 (0.039)

Glass

The complete code example for achieving baseline and a good result on this dataset is listed below.

# baseline and good result for Glass
from numpy import mean
from numpy import std
from pandas import read_csv
from sklearn.preprocessing import LabelEncoder
from sklearn.model_selection import cross_val_score
from sklearn.model_selection import RepeatedStratifiedKFold
from sklearn.dummy import DummyClassifier
from sklearn.ensemble import RandomForestClassifier
# load dataset
url = 'https://raw.githubusercontent.com/jbrownlee/Datasets/master/glass.csv'
dataframe = read_csv(url, header=None)
data = dataframe.values
X, y = data[:, :-1], data[:, -1]
print('Shape: %s, %s' % (X.shape,y.shape))
# minimally prepare dataset
X = X.astype('float32')
y = LabelEncoder().fit_transform(y.astype('str'))
# evaluate naive
naive = DummyClassifier(strategy='most_frequent')
cv = RepeatedStratifiedKFold(n_splits=10, n_repeats=3, random_state=1)
n_scores = cross_val_score(naive, X, y, scoring='accuracy', cv=cv, n_jobs=-1, error_score='raise')
print('Baseline: %.3f (%.3f)' % (mean(n_scores), std(n_scores)))
# evaluate model
model = RandomForestClassifier(n_estimators=100,max_features=2)
m_scores = cross_val_score(model, X, y, scoring='accuracy', cv=cv, n_jobs=-1, error_score='raise')
print('Good: %.3f (%.3f)' % (mean(m_scores), std(m_scores)))

Running the example, you should see the following results.

Shape: (214, 9), (214,)
Baseline: 0.356 (0.013)
Good: 0.744 (0.085)

Wine

The complete code example for achieving baseline and a good result on this dataset is listed below.

# baseline and good result for Wine
from numpy import mean
from numpy import std
from pandas import read_csv
from sklearn.preprocessing import LabelEncoder
from sklearn.model_selection import cross_val_score
from sklearn.model_selection import RepeatedStratifiedKFold
from sklearn.pipeline import Pipeline
from sklearn.preprocessing import StandardScaler
from sklearn.preprocessing import MinMaxScaler
from sklearn.dummy import DummyClassifier
from sklearn.discriminant_analysis import QuadraticDiscriminantAnalysis
# load dataset
url = 'https://raw.githubusercontent.com/jbrownlee/Datasets/master/wine.csv'
dataframe = read_csv(url, header=None)
data = dataframe.values
X, y = data[:, :-1], data[:, -1]
print('Shape: %s, %s' % (X.shape,y.shape))
# minimally prepare dataset
X = X.astype('float32')
y = LabelEncoder().fit_transform(y.astype('str'))
# evaluate naive
naive = DummyClassifier(strategy='most_frequent')
cv = RepeatedStratifiedKFold(n_splits=10, n_repeats=3, random_state=1)
n_scores = cross_val_score(naive, X, y, scoring='accuracy', cv=cv, n_jobs=-1, error_score='raise')
print('Baseline: %.3f (%.3f)' % (mean(n_scores), std(n_scores)))
# evaluate model
model = QuadraticDiscriminantAnalysis()
steps = [('s',StandardScaler()), ('n',MinMaxScaler()), ('m',model)]
pipeline = Pipeline(steps=steps)
m_scores = cross_val_score(pipeline, X, y, scoring='accuracy', cv=cv, n_jobs=-1, error_score='raise')
print('Good: %.3f (%.3f)' % (mean(m_scores), std(m_scores)))

Running the example, you should see the following results.

Shape: (178, 13), (178,)
Baseline: 0.399 (0.017)
Good: 0.992 (0.020)

Wheat Seeds

The complete code example for achieving baseline and a good result on this dataset is listed below.

# baseline and good result for Wine
from numpy import mean
from numpy import std
from pandas import read_csv
from sklearn.preprocessing import LabelEncoder
from sklearn.model_selection import cross_val_score
from sklearn.model_selection import RepeatedStratifiedKFold
from sklearn.pipeline import Pipeline
from sklearn.preprocessing import StandardScaler
from sklearn.dummy import DummyClassifier
from sklearn.linear_model import RidgeClassifier
# load dataset
url = 'https://raw.githubusercontent.com/jbrownlee/Datasets/master/wheat-seeds.csv'
dataframe = read_csv(url, header=None)
data = dataframe.values
X, y = data[:, :-1], data[:, -1]
print('Shape: %s, %s' % (X.shape,y.shape))
# minimally prepare dataset
X = X.astype('float32')
y = LabelEncoder().fit_transform(y.astype('str'))
# evaluate naive
naive = DummyClassifier(strategy='most_frequent')
cv = RepeatedStratifiedKFold(n_splits=10, n_repeats=3, random_state=1)
n_scores = cross_val_score(naive, X, y, scoring='accuracy', cv=cv, n_jobs=-1, error_score='raise')
print('Baseline: %.3f (%.3f)' % (mean(n_scores), std(n_scores)))
# evaluate model
model = RidgeClassifier(alpha=0.2)
steps = [('s',StandardScaler()), ('m',model)]
pipeline = Pipeline(steps=steps)
m_scores = cross_val_score(pipeline, X, y, scoring='accuracy', cv=cv, n_jobs=-1, error_score='raise')
print('Good: %.3f (%.3f)' % (mean(m_scores), std(m_scores)))

Running the example, you should see the following results.

Shape: (210, 7), (210,)
Baseline: 0.333 (0.000)
Good: 0.973 (0.036)

Results for Regression Datasets

Regression is a predictive modeling problem that predicts a numerical value given one or more input variables.

The baseline model for classification tasks is a model that predicts the mean or median value. This can be achieved in scikit-learn using the DummyRegressor class using the ‘median‘ strategy; for example:

...
model = DummyRegressor(strategy='median')

The standard evaluation for regression models is mean absolute error (MAE), although this is not ideal for all regression problems. Nevertheless, for better or worse, this score will be used (for now).

MAE is reported as an error score between 0 (perfect skill) and a very large number or infinity (no skill).

In this section, we will review the baseline and good performance on the following regression predictive modeling datasets:

  1. Housing
  2. Auto Insurance
  3. Abalone
  4. Auto Imports

Housing

The complete code example for achieving baseline and a good result on this dataset is listed below.

# baseline and good result for Housing
from numpy import mean
from numpy import std
from numpy import absolute
from pandas import read_csv
from sklearn.model_selection import cross_val_score
from sklearn.model_selection import RepeatedKFold
from sklearn.dummy import DummyRegressor
from xgboost import XGBRegressor
# load dataset
url = 'https://raw.githubusercontent.com/jbrownlee/Datasets/master/housing.csv'
dataframe = read_csv(url, header=None)
data = dataframe.values
X, y = data[:, :-1], data[:, -1]
print('Shape: %s, %s' % (X.shape,y.shape))
# minimally prepare dataset
X = X.astype('float32')
y = y.astype('float32')
# evaluate naive
naive = DummyRegressor(strategy='median')
cv = RepeatedKFold(n_splits=10, n_repeats=3, random_state=1)
n_scores = cross_val_score(naive, X, y, scoring='neg_mean_absolute_error', cv=cv, n_jobs=-1, error_score='raise')
n_scores = absolute(n_scores)
print('Baseline: %.3f (%.3f)' % (mean(n_scores), std(n_scores)))
# evaluate model
model = XGBRegressor(learning_rate=0.1, n_estimators=100, subsample=0.7, max_depth=9, colsample_bynode=0.6, objective='reg:squarederror')
m_scores = cross_val_score(model, X, y, scoring='neg_mean_absolute_error', cv=cv, n_jobs=-1, error_score='raise')
m_scores = absolute(m_scores)
print('Good: %.3f (%.3f)' % (mean(m_scores), std(m_scores)))

Running the example, you should see the following results.

Shape: (506, 13), (506,)
Baseline: 6.660 (0.706)
Good: 1.955 (0.279)

Auto Insurance

The complete code example for achieving baseline and a good result on this dataset is listed below.

# baseline and good result for Auto Insurance
from numpy import mean
from numpy import std
from numpy import absolute
from pandas import read_csv
from sklearn.model_selection import cross_val_score
from sklearn.model_selection import RepeatedKFold
from sklearn.pipeline import Pipeline
from sklearn.compose import TransformedTargetRegressor
from sklearn.preprocessing import PowerTransformer
from sklearn.dummy import DummyRegressor
from sklearn.linear_model import HuberRegressor
# load dataset
url = 'https://raw.githubusercontent.com/jbrownlee/Datasets/master/auto-insurance.csv'
dataframe = read_csv(url, header=None)
data = dataframe.values
X, y = data[:, :-1], data[:, -1]
print('Shape: %s, %s' % (X.shape,y.shape))
# minimally prepare dataset
X = X.astype('float32')
y = y.astype('float32')
# evaluate naive
naive = DummyRegressor(strategy='median')
cv = RepeatedKFold(n_splits=10, n_repeats=3, random_state=1)
n_scores = cross_val_score(naive, X, y, scoring='neg_mean_absolute_error', cv=cv, n_jobs=-1, error_score='raise')
n_scores = absolute(n_scores)
print('Baseline: %.3f (%.3f)' % (mean(n_scores), std(n_scores)))
# evaluate model
model = HuberRegressor(epsilon=1.0, alpha=0.001)
steps = [('p',PowerTransformer()), ('m',model)]
pipeline = Pipeline(steps=steps)
target = TransformedTargetRegressor(regressor=pipeline, transformer=PowerTransformer())
m_scores = cross_val_score(target, X, y, scoring='neg_mean_absolute_error', cv=cv, n_jobs=-1, error_score='raise')
m_scores = absolute(m_scores)
print('Good: %.3f (%.3f)' % (mean(m_scores), std(m_scores)))

Running the example, you should see the following results.

Shape: (63, 1), (63,)
Baseline: 66.624 (19.303)
Good: 28.358 (9.747)

Abalone

The complete code example for achieving baseline and a good result on this dataset is listed below.

# baseline and good result for Abalone
from numpy import mean
from numpy import std
from numpy import absolute
from pandas import read_csv
from sklearn.model_selection import cross_val_score
from sklearn.model_selection import RepeatedKFold
from sklearn.pipeline import Pipeline
from sklearn.compose import TransformedTargetRegressor
from sklearn.preprocessing import OneHotEncoder
from sklearn.preprocessing import PowerTransformer
from sklearn.compose import ColumnTransformer
from sklearn.dummy import DummyRegressor
from sklearn.svm import SVR
# load dataset
url = 'https://raw.githubusercontent.com/jbrownlee/Datasets/master/abalone.csv'
dataframe = read_csv(url, header=None)
data = dataframe.values
X, y = data[:, :-1], data[:, -1]
print('Shape: %s, %s' % (X.shape,y.shape))
# minimally prepare dataset
y = y.astype('float32')
# evaluate naive
naive = DummyRegressor(strategy='median')
transform = ColumnTransformer(transformers=[('c', OneHotEncoder(), [0])], remainder='passthrough')
pipeline = Pipeline(steps=[('ColumnTransformer',transform), ('Model',naive)])
cv = RepeatedKFold(n_splits=10, n_repeats=3, random_state=1)
n_scores = cross_val_score(pipeline, X, y, scoring='neg_mean_absolute_error', cv=cv, n_jobs=-1, error_score='raise')
n_scores = absolute(n_scores)
print('Baseline: %.3f (%.3f)' % (mean(n_scores), std(n_scores)))
# evaluate model
model = SVR(kernel='rbf',gamma='scale',C=10)
target = TransformedTargetRegressor(regressor=model, transformer=PowerTransformer(), check_inverse=False)
pipeline = Pipeline(steps=[('ColumnTransformer',transform), ('Model',target)])
m_scores = cross_val_score(pipeline, X, y, scoring='neg_mean_absolute_error', cv=cv, n_jobs=-1, error_score='raise')
m_scores = absolute(m_scores)
print('Good: %.3f (%.3f)' % (mean(m_scores), std(m_scores)))

Running the example, you should see the following results.

Shape: (4177, 8), (4177,)
Baseline: 2.363 (0.116)
Good: 1.460 (0.075)

Auto Imports

The complete code example for achieving baseline and a good result on this dataset is listed below.

# baseline and good result for Auto Imports
from numpy import mean
from numpy import std
from numpy import absolute
from pandas import read_csv
from sklearn.preprocessing import LabelEncoder
from sklearn.model_selection import cross_val_score
from sklearn.model_selection import RepeatedKFold
from sklearn.pipeline import Pipeline
from sklearn.preprocessing import OneHotEncoder
from sklearn.compose import ColumnTransformer
from sklearn.impute import SimpleImputer
from sklearn.dummy import DummyRegressor
from sklearn.ensemble import RandomForestRegressor
# load dataset
url = 'https://raw.githubusercontent.com/jbrownlee/Datasets/master/auto_imports.csv'
dataframe = read_csv(url, header=None, na_values='?')
data = dataframe.values
X, y = data[:, :-1], data[:, -1]
print('Shape: %s, %s' % (X.shape,y.shape))
y = y.astype('float32')
# evaluate naive
naive = DummyRegressor(strategy='median')
cat_ix = [2,3,4,5,6,7,8,14,15,17]
num_ix = [0,1,9,10,11,12,13,16,18,19,20,21,22,23,24]
steps = [('c', Pipeline(steps=[('s',SimpleImputer(strategy='most_frequent')),('oe',OneHotEncoder(handle_unknown='ignore'))]), cat_ix), ('n', SimpleImputer(strategy='median'), num_ix)]
transform = ColumnTransformer(transformers=steps, remainder='passthrough')
pipeline = Pipeline(steps=[('ColumnTransformer',transform), ('Model',naive)])
cv = RepeatedKFold(n_splits=10, n_repeats=3, random_state=1)
n_scores = cross_val_score(pipeline, X, y, scoring='neg_mean_absolute_error', cv=cv, n_jobs=-1, error_score='raise')
n_scores = absolute(n_scores)
print('Baseline: %.3f (%.3f)' % (mean(n_scores), std(n_scores)))
# evaluate model
model = RandomForestRegressor(n_estimators=100,max_features=10)
pipeline = Pipeline(steps=[('ColumnTransformer',transform), ('Model',model)])
m_scores = cross_val_score(pipeline, X, y, scoring='neg_mean_absolute_error', cv=cv, n_jobs=-1, error_score='raise')
m_scores = absolute(m_scores)
print('Good: %.3f (%.3f)' % (mean(m_scores), std(m_scores)))

Running the example, you should see the following results.

Shape: (201, 25), (201,)
Baseline: 5880.718 (1197.967)
Good: 1405.420 (317.683)

Further Reading

This section provides more resources on the topic if you are looking to go deeper.

Tutorials

Articles

Summary

In this post, you discovered standard machine learning datasets for classification and regression and the baseline and good results that one may expect to achieve on each.

Specifically, you learned:

  • The importance of standard machine learning datasets.
  • How to systematically evaluate a model on a standard machine learning dataset.
  • Standard datasets for classification and regression and the baseline and good performance expected on each.

Did I miss your favorite dataset?
Let me know in the comments and I will calculate a score for it, or perhaps even add it to this post.

Can you get a better score for a dataset?
I would love to know; share your model and score in the comments below and I will try to reproduce it and update the post (and give you full credit!)

Do you have any questions?
Ask your questions in the comments below and I will do my best to answer.

The post Results for Standard Classification and Regression Machine Learning Datasets appeared first on Machine Learning Mastery.
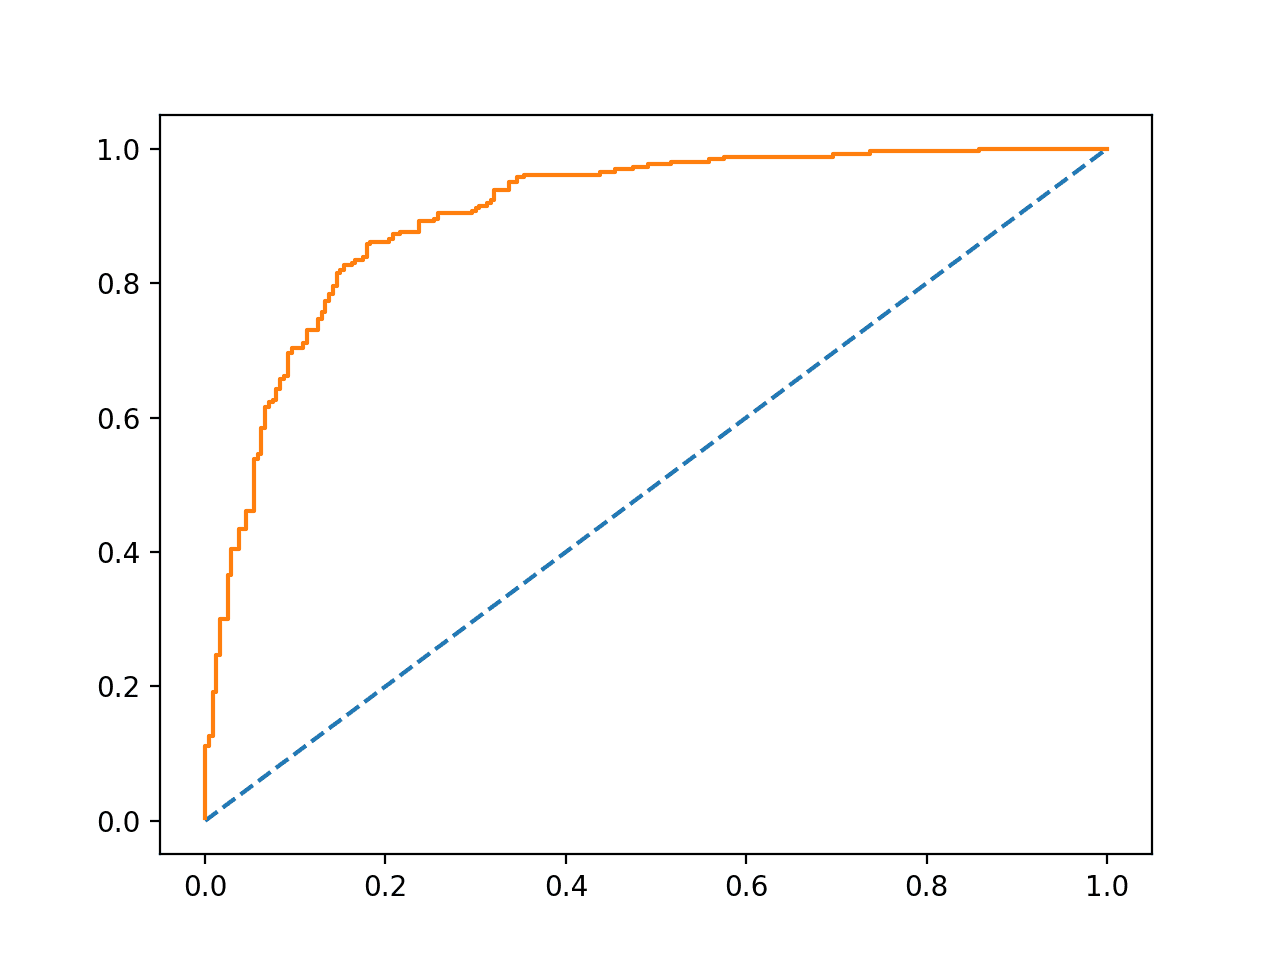
Use the ColumnTransformer for Numerical and Categorical Data in Python

$
0
0

You must prepare your raw data using data transforms prior to fitting a machine learning model.

This is required to ensure that you best expose the structure of your predictive modeling problem to the learning algorithms.

Applying data transforms like scaling or encoding categorical variables is straightforward when all input variables are the same type. It can be challenging when you have a dataset with mixed types and you want to selectively apply data transforms to some, but not all, input features.

Thankfully, the scikit-learn Python machine learning library provides the ColumnTransformer that allows you to selectively apply data transforms to different columns in your dataset.

In this tutorial, you will discover how to use the ColumnTransformer to selectively apply data transforms to columns in a dataset with mixed data types.

After completing this tutorial, you will know:

  • The challenge of using data transformations with datasets that have mixed data types.
  • How to define, fit, and use the ColumnTransformer to selectively apply data transforms to columns.
  • How to work through a real dataset with mixed data types and use the ColumnTransformer to apply different transforms to categorical and numerical data columns.

Let’s get started.

Use the ColumnTransformer for Numerical and Categorical Data in Python

Use the ColumnTransformer for Numerical and Categorical Data in Python
Photo by Kari, some rights reserved.

Tutorial Overview

This tutorial is divided into three parts; they are:

  1. Challenge of Transforming Different Data Types
  2. How to use the ColumnTransformer
  3. Data Preparation for the Abalone Regression Dataset

Challenge of Transforming Different Data Types

It is important to prepare data prior to modeling.

This may involve replacing missing values, scaling numerical values, and one hot encoding categorical data.

Data transforms can be performed using the scikit-learn library; for example, the SimpleImputer class can be used to replace missing values, the MinMaxScaler class can be used to scale numerical values, and the OneHotEncoder can be used to encode categorical variables.

For example:

...
# prepare transform
scaler = MinMaxScaler()
# fit transform on training data
scaler.fit(train_X)
# transform training data
train_X = scaler.transform(train_X)

Sequences of different transforms can also be chained together using the Pipeline, such as imputing missing values, then scaling numerical values.

For example:

...
# define pipeline
pipeline = Pipeline(steps=[('i', SimpleImputer(strategy='median')), ('s', MinMaxScaler())])
# transform training data
train_X = scaler.fit_transform(train_X)

It is very common to want to perform different data preparation techniques on different columns in your input data.

For example, you may want to impute missing numerical values with a median value, then scale the values and impute missing categorical values using the most frequent value and one hot encode the categories.

Traditionally, this would require you to separate the numerical and categorical data and then manually apply the transforms on those groups of features before combining the columns back together in order to fit and evaluate a model.

Now, you can use the ColumnTransformer to perform this operation for you.

How to use the ColumnTransformer

The ColumnTransformer is a class in the scikit-learn Python machine learning library that allows you to selectively apply data preparation transforms.

For example, it allows you to apply a specific transform or sequence of transforms to just the numerical columns, and a separate sequence of transforms to just the categorical columns.

To use the ColumnTransformer, you must specify a list of transformers.

Each transformer is a three-element tuple that defines the name of the transformer, the transform to apply, and the column indices to apply it to. For example:

  • (Name, Object, Columns)

For example, the ColumnTransformer below applies a OneHotEncoder to columns 0 and 1.

transformer = ColumnTransformer(transformers=[('cat', OneHotEncoder(), [0, 1])])

The example below applies a SimpleImputer with median imputing for numerical columns 0 and 1, and SimpleImputer with most frequent imputing to categorical columns 2 and 3.

t = [('num', SimpleImputer(strategy='median'), [0, 1]), ('cat', SimpleImputer(strategy='most_frequent'), [2, 3])]
transformer = ColumnTransformer(transformers=t)

Any columns not specified in the list of “transformers” are dropped from the dataset by default; this can be changed by setting the “remainder” argument.

Setting remainder=’passthrough’ will mean that all columns not specified in the list of “transformers” will be passed through without transformation, instead of being dropped.

For example, if columns 0 and 1 were numerical and columns 2 and 3 were categorical and we wanted to just transform the categorical data and pass through the numerical columns unchanged, we could define the ColumnTransformer as follows:

transformer = ColumnTransformer(transformers=[('cat', OneHotEncoder(), [2, 3])], remainder='passthrough')

Once the transformer is defined, it can be used to transform a dataset.

For example:

...
transformer = ColumnTransformer(transformers=[('cat', OneHotEncoder(), [0, 1])])
# transform training data
train_X = transformer.fit_transform(train_X)

A ColumnTransformer can also be used in a Pipeline to selectively prepare the columns of your dataset before fitting a model on the transformed data.

This is the most likely use case as it ensures that the transforms are performed automatically on the raw data when fitting the model and when making predictions, such as when evaluating the model on a test dataset via cross-validation or making predictions on new data in the future.

For example:

...
# define model
model = LogisticRegression()
# define transform
transformer = ColumnTransformer(transformers=[('cat', OneHotEncoder(), [0, 1])])
# define pipeline
pipeline = Pipeline(steps=[('t', transformer), ('m',model)])
# fit the model on the transformed data
model.fit(train_X, train_y)
# make predictions
yhat = model.predict(test_X)

Now that we are familiar with how to configure and use the ColumnTransformer in general, let’s look at a worked example.

Data Preparation for the Abalone Regression Dataset

The abalone dataset is a standard machine learning problem that involves predicting the age of an abalone given measurements of an abalone.

You can download the dataset and learn more about it here:

The dataset has 4,177 examples, 8 input variables, and the target variable is an integer.

A naive model can achieve a mean absolute error (MAE) of about 2.363 (std 0.092) by predicting the mean value, evaluated via 10-fold cross-validation.

We can model this as a regression predictive modeling problem with a support vector machine model (SVR).

Reviewing the data, you can see the first few rows as follows:

M,0.455,0.365,0.095,0.514,0.2245,0.101,0.15,15
M,0.35,0.265,0.09,0.2255,0.0995,0.0485,0.07,7
F,0.53,0.42,0.135,0.677,0.2565,0.1415,0.21,9
M,0.44,0.365,0.125,0.516,0.2155,0.114,0.155,10
I,0.33,0.255,0.08,0.205,0.0895,0.0395,0.055,7
...

We can see that the first column is categorical and the remainder of the columns are numerical.

We may want to one hot encode the first column and normalize the remaining numerical columns, and this can be achieved using the ColumnTransformer.

First, we need to load the dataset. We can load the dataset directly from the URL using the read_csv() Pandas function, then split the data into two data frames: one for input and one for the output.

The complete example of loading the dataset is listed below.

# load the dataset
from pandas import read_csv
# load dataset
url = 'https://raw.githubusercontent.com/jbrownlee/Datasets/master/abalone.csv'
dataframe = read_csv(url, header=None)
# split into inputs and outputs
last_ix = len(dataframe.columns) - 1
X, y = dataframe.drop(last_ix, axis=1), dataframe[last_ix]
print(X.shape, y.shape)

Note: if you have trouble loading the dataset from a URL, you can download the CSV file with the name ‘abalone.csv‘ and place it in the same directory as your Python file and change the call to read_csv() as follows:

...
dataframe = read_csv('abalone.csv', header=None)

Running the example, we can see that the dataset is loaded correctly and split into eight input columns and one target column.

(4177, 8) (4177,)

Next, we can use the select_dtypes() function to select the column indexes that match different data types.

We are interested in a list of columns that are numerical columns marked as ‘float64‘ or ‘int64‘ in Pandas, and a list of categorical columns, marked as ‘object‘ or ‘bool‘ type in Pandas.

...
# determine categorical and numerical features
numerical_ix = X.select_dtypes(include=['int64', 'float64']).columns
categorical_ix = X.select_dtypes(include=['object', 'bool']).columns

We can then use these lists in the ColumnTransformer to one hot encode the categorical variables, which should just be the first column.

We can also use the list of numerical columns to normalize the remaining data.

...
# define the data preparation for the columns
t = [('cat', OneHotEncoder(), categorical_ix), ('num', MinMaxScaler(), numerical_ix)]
col_transform = ColumnTransformer(transformers=t)

Next, we can define our SVR model and define a Pipeline that first uses the ColumnTransformer, then fits the model on the prepared dataset.

...
# define the model
model = SVR(kernel='rbf',gamma='scale',C=100)
# define the data preparation and modeling pipeline
pipeline = Pipeline(steps=[('prep',col_transform), ('m', model)])

Finally, we can evaluate the model using 10-fold cross-validation and calculate the mean absolute error, averaged across all 10 evaluations of the pipeline.

...
# define the model cross-validation configuration
cv = KFold(n_splits=10, shuffle=True, random_state=1)
# evaluate the pipeline using cross validation and calculate MAE
scores = cross_val_score(pipeline, X, y, scoring='neg_mean_absolute_error', cv=cv, n_jobs=-1)
# convert MAE scores to positive values
scores = absolute(scores)
# summarize the model performance
print('MAE: %.3f (%.3f)' % (mean(scores), std(scores)))

Tying this all together, the complete example is listed below.

# example of using the ColumnTransformer for the Abalone dataset
from numpy import mean
from numpy import std
from numpy import absolute
from pandas import read_csv
from sklearn.model_selection import cross_val_score
from sklearn.model_selection import KFold
from sklearn.compose import ColumnTransformer
from sklearn.pipeline import Pipeline
from sklearn.preprocessing import OneHotEncoder
from sklearn.preprocessing import MinMaxScaler
from sklearn.svm import SVR

# load dataset
url = 'https://raw.githubusercontent.com/jbrownlee/Datasets/master/abalone.csv'
dataframe = read_csv(url, header=None)
# split into inputs and outputs
last_ix = len(dataframe.columns) - 1
X, y = dataframe.drop(last_ix, axis=1), dataframe[last_ix]
print(X.shape, y.shape)
# determine categorical and numerical features
numerical_ix = X.select_dtypes(include=['int64', 'float64']).columns
categorical_ix = X.select_dtypes(include=['object', 'bool']).columns
# define the data preparation for the columns
t = [('cat', OneHotEncoder(), categorical_ix), ('num', MinMaxScaler(), numerical_ix)]
col_transform = ColumnTransformer(transformers=t)
# define the model
model = SVR(kernel='rbf',gamma='scale',C=100)
# define the data preparation and modeling pipeline
pipeline = Pipeline(steps=[('prep',col_transform), ('m', model)])
# define the model cross-validation configuration
cv = KFold(n_splits=10, shuffle=True, random_state=1)
# evaluate the pipeline using cross validation and calculate MAE
scores = cross_val_score(pipeline, X, y, scoring='neg_mean_absolute_error', cv=cv, n_jobs=-1)
# convert MAE scores to positive values
scores = absolute(scores)
# summarize the model performance
print('MAE: %.3f (%.3f)' % (mean(scores), std(scores)))

Running the example evaluates the data preparation pipeline using 10-fold cross-validation.

Your specific results may vary given the stochastic learning algorithm and differences in library versions.

In this case, we achieve an average MAE of about 1.4, which is better than the baseline score of 2.3.

(4177, 8) (4177,)
MAE: 1.465 (0.047)

You now have a template for using the ColumnTransformer on a dataset with mixed data types that you can use and adapt for your own projects in the future.

Further Reading

This section provides more resources on the topic if you are looking to go deeper.

API

Summary

In this tutorial, you discovered how to use the ColumnTransformer to selectively apply data transforms to columns in datasets with mixed data types.

Specifically, you learned:

  • The challenge of using data transformations with datasets that have mixed data types.
  • How to define, fit, and use the ColumnTransformer to selectively apply data transforms to columns.
  • How to work through a real dataset with mixed data types and use the ColumnTransformer to apply different transforms to categorical and numerical data columns.

Do you have any questions?
Ask your questions in the comments below and I will do my best to answer.

The post Use the ColumnTransformer for Numerical and Categorical Data in Python appeared first on Machine Learning Mastery.

Viewing all 255 articles
Browse latest View live